

On Friday, the Office for National Statistics published its latest estimate of GDP for the 2nd Quarter of 2013. The previous quarter-on-quarter ‘growth’ estimate (in volume terms) was raised from 0.6% to 0.7% (and 1.5% year-on-year). This has sparked a veritable bubble in reports of a great British economic recovery.
However, GDP is just 2.2% higher today than in Q2 of 2010 (when the Coalition Government came to office), which means that GDP per head of population (UK population is increasing at about 0.8% per year) is completely flat, following the big drop in 2008/9.
Just before the 2010 election, the then Shadow Chancellor, George Osborne, gave the Mais lecture in which he set out his economic approach. He said:
“We have to move to a new model of economic growth that is rooted in more investment, more savings and higher exports.”
Amongst the “eight benchmarks” against which to judge a future Conservative government over the next Parliament, he included:
“We will increase saving, business investment and exports as a share of GDP”
On the GDP figures, the FT and Daily Telegraph quoted an anonymous Treasury spokesman as saying:
“This data confirms that the British economy is moving from rescue to recovery, supported by balanced growth across the economy.”
But a closer look shows that so far, UK’s growth is far from “balanced”. Compared to 2010, when the government came to office, exports have indeed risen (though a wide trade gap remains), but capital investment has fallen back severely, overall industrial production has fallen, manufacturing has stagnated and construction collapsed, while some service areas have surged ahead.
The most worrying aspect of all is capital investment. Far from taking off again, it has continued to slide. The ONS statistics for real-terms investment (GFCF) show that total capital investment in the first 6 months of 2013 was the lowest half-year since the first half of 1998 – 15 long years ago. Worse still, in the first half of 2013, business investment – George Osborne’s benchmark – fell to its lowest level since the ONS dataset began in 1997.
It is one-third lower than the highest half year in 2007, and 22% below the average for the whole period!
Here are the charts showing total investment (1998 to 2013), and business investment (1997 to 2013), using ONS data
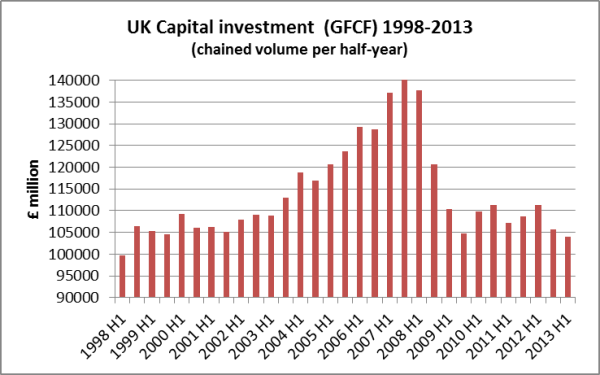
UK total investment 1998-2013 2
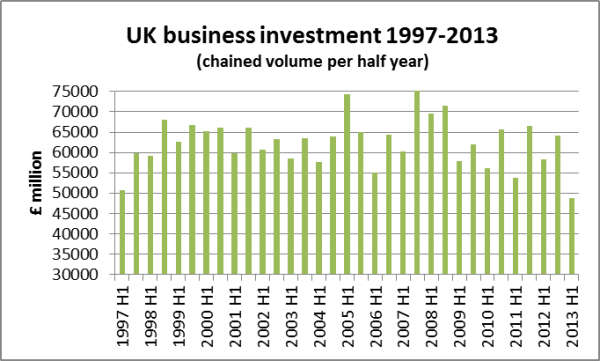
UK business investment 1997-2013 2


2 Responses
it is very hard to find investment in u.k. I should have invested in American companies, I would have been rich man, like Ford, Wydham corporation, Tenet Health corp., Goodyear tyre and plenty more. While u.k is suffering with high debt and no future, I would advise youngsters to leave this country where sun is not going to shine. Thanks.
God almighty, UK population is increasing at about 0.8% per year – how sustainable is that? 480,000 extra people? Is that a city the size of Bristol every year?
I suspect this figure is wrong.
We need a free bank, that doesn’t have government appointed committees to set interest rates – this Soviet style crony capitalism benefits the 1% and no one else.
Governement spending is inefficient. We need a proper market rate for borrowing to kill off the zombie debtors and a true recovery can begin – I believe this is precisely what happened in the post WW1 USA economy.
Keynsians make the mistake that the economy is an engine that needs tweaking – it’s not it’s a 100 million engines that no government can possibly control to a satisfying outcome. Dismantle crony capitalism!