

The Office of National Statistics (ONS) has today published the latest UK industrial production including manufacturing statistics – for November 2015 – and they do not make very pretty reading. Indeed, they appear to confirm the general slowdown apparent in the course of 2015 across the wider economy, and touched on in our recent EREP Review of the UK Economy 2015, “the Cracks Begin to Show”.
Total production output is estimated to have increased by just 0.9% in November 2015 compared with the same month a year ago. This is despite the fact that “mining and quarrying” (these days mainly North Sea oil and gas) increased in volume terms by 10.5%, following the end of maintenance and some new investment in recent months. However, this apparent uptick coincides with the continuing collapse of oil prices (so in current prices this change would be modest indeed).
The most concerning part of the story is that the largest component (some seven-tenths of the overall index) – manufacturing – saw a year-on-year decrease of 1.2%. This marks 5 consecutive months of year-on-year falls in manufacturing production.
Compared to the previous month (October), manufacturing output fell by 0.4% in November.
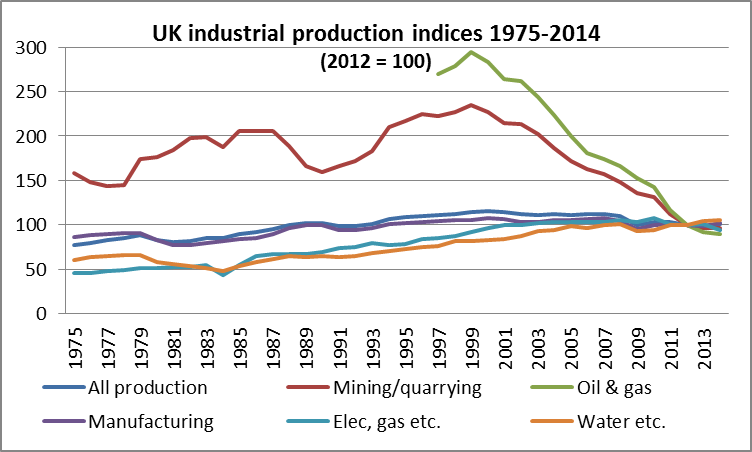
Taking a longer historical view, the following 40 year chart (1975 to 2014) shows the evolution of the indices for the different components of industrial production, and for total production, where 2012 = 100. Contrary to widespread impression that the halcyon days of peak manufacturing and total production were in the pre-Thatcher period, in fact the highest levels reached were in the period 1997 to 2008. (NB oil and gas is a subset of mining/quarrying).
Taking the latest quarterly figure (Q3 2015) and comparing to the peak Quarter for total production and for manufacturing (in both cases 2000 Q4), the fall has been around 13% for production, and around 7% for manufacturing.
Total production is down about 1% from the level when the Conservative-led Coalition government came to office in Q2 2010, and peaked post-crisis in Q4 2010. Manufacturing output is up 2.3% from the Q2 2010 level, but down around 1% on (the post-crisis peak to date) Q4 2014 and Q1 2015.


