

By Jeremy Smith
Last week, we pulled together and tweeted a set of charts (including a few screenshots of charts we found) about the Thatcher government’s economic record. They show that on all key fronts, her government failed, absolutely or by comparison with other UK governments over the last 60 or so years. We have now added some more charts, and offer the information they contain as an antidote to the British establishment’s evidence-lite but ideology-heavy eulogies of her government’s economic performance.
We look at the record on unemployment, GDP changes, manufacturing employment, inflation, current account… and note that her government had the political good fortune of near-peak UK North Sea Oil, whose benefits were thrown away in plugging short term economic gaps, rather than invested for the long term.
Above all, her deregulation of finance and the City of London (continued alas by her successors) set the UK on a false path, one that has severely damaged the UK’s economy and social fabric. And continues to do so. Near the end of this blog, you can find a chart on private sector (especially financial sector) indebtedness which -far outstrippping public sector debt – started to balloon in the late 1980s.
Unemployment
Under Mrs Thatcher’s government, UK unemployment reached its highest post WW2 record. It was over 3 million for 4 long years, a level it has not reached even in difficult times before or since. It was achieved with staggering speed as the economy was, from 1979, kicked into rapid de-industrialisation.
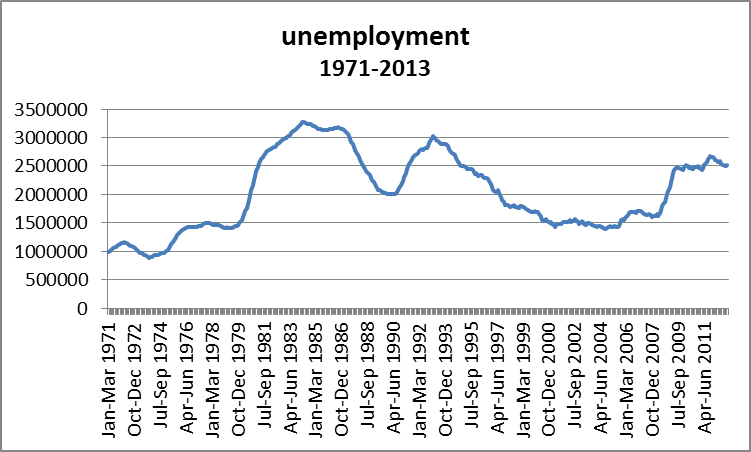
UK unemp 1971-2013
GDP annual changes – a declining trend
Under the Thatcher governments, GDP fell sharply in 1979/80, rose during the Lawson boom, and fell again sharply in 1989/90. But as the next two charts show, the overall trend was no higher than for the whole period 1948 to 2012. In fact, the average increase in GDP from 1948 to 1976 was considerably higher than for the period since then, even though much of it was – especially from the late 1980s – private debt-fuelled. So much for the much-vaunted positive effect the Thatcher government’s economic policies compared to the earlier period.
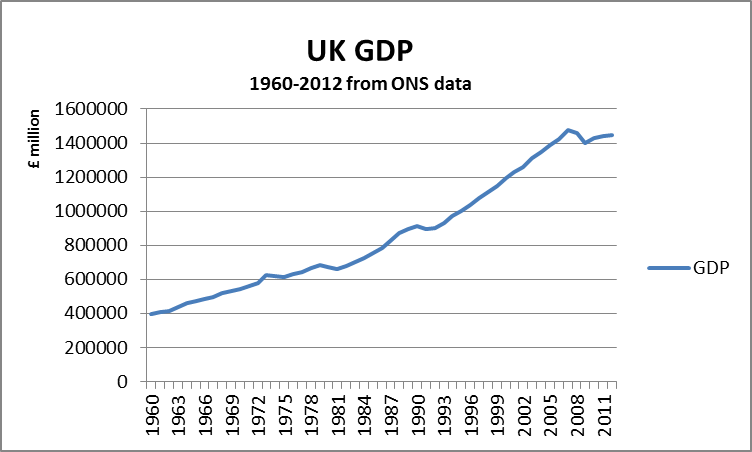
uk gdp 1960 to 2012
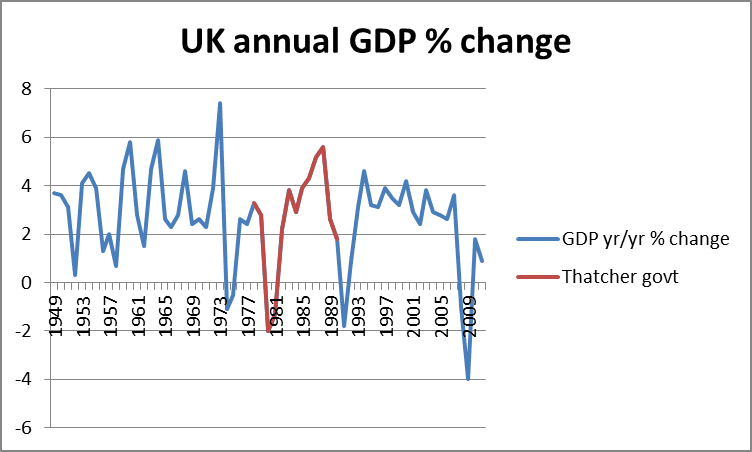
UK annual GDP change
Manufacturing jobs – the savage decline
The rapid and large-scale increase in unemployment from 1989 was largely due to the cull of manufacturing and industrial production. The falls in employment came in two great waves: a vast 1.5 million manufacturing jobs (22.52% of the the 1979 total) were lost in just 4 years from December 1979-83, and there was a further fall of 16,83% (from the lower base) in the 3 years from September 1989 through to 1982. This appears in the two big steps down in the next chart.
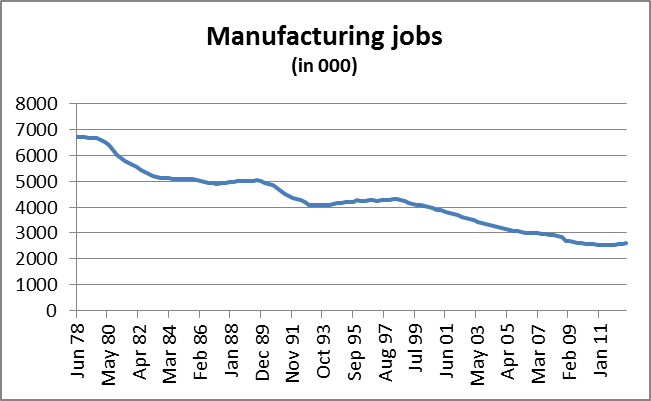
UK Manuf chart 1978 – 2012
The following chart shows manufacturing as a percentage of GDP, rather than simply in employment terms. Each point represents a 5 year period. The UK started relatively low, fell sharply under the Thatcher government in its early phase, and has continued to decline till it is bottom of the “league table”.
Source Curious Cat economics blog
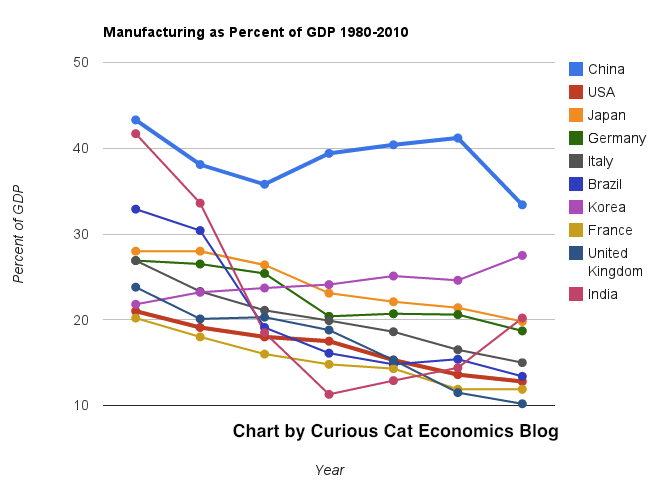
manuf 10 countries as pc of gdp Sep 2012
UK current account
The worst period for the current account (mainly our trade in goods and services) in our post-war history took place under the Thatcher government’s watch. The three years from 1988-90 were (with -3.9, -4.6, -3.5%) the worst three together post-war, and the only comparisons are with 1974(-4%) and…2012 (-3.7%).
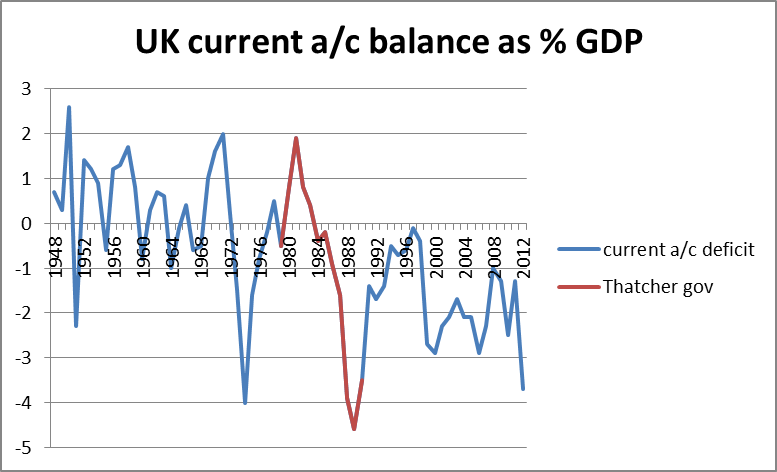
UK current account to 2012
Inflation
It is often argued that the Thatcher government saved the nation from the high inflation of the 1970s. In fact, the record is very mixed. RPI inflation increase had fallen in 1978 to 8.4%, before rising in the first Thatcher years (1979-81)to 17.2%, 15.1% and 12.0%. It then fell back sharply until the late 1980s when it shot back up again – to levels not seen since – 1988 6.8%, 1989 7.7% and 1990 9.3%. So it can be said that she inherited an inflation rate of 7.8% but rising, and finished with 9.3%! This is hardly the stuff of which legends should be built.
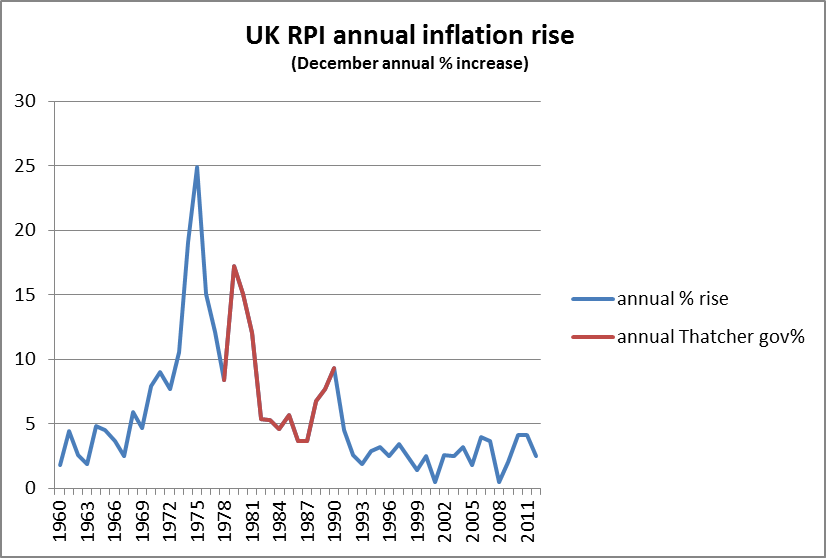
UK RPI Inflation to 2012
The North Sea Oil boost
As we said at the start, the near-peak years of North Sea Oil were used to bolster the economy in the short-term, not to build a lasting asset for the future like Norway. The first screenshot chart below shows that a staggering 6+% of GDP came from oil and gas production in the first Thatcher government years. Without this windfall of political luck, her economic strategy for the early years would have been even more disastrous (our screenshot on this for some reason won’t show!). The second chart shows how oil almost peaked under the Thatcher government, though oil and gas together climbed higher from 1990 to 2000 before falling sharply in recent years.
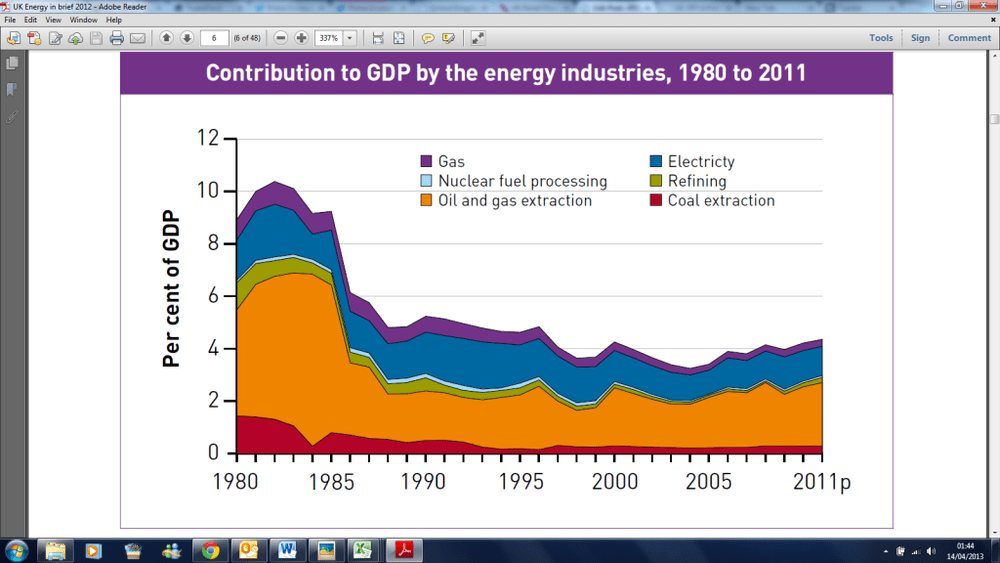
Energy production as contribution to GDP
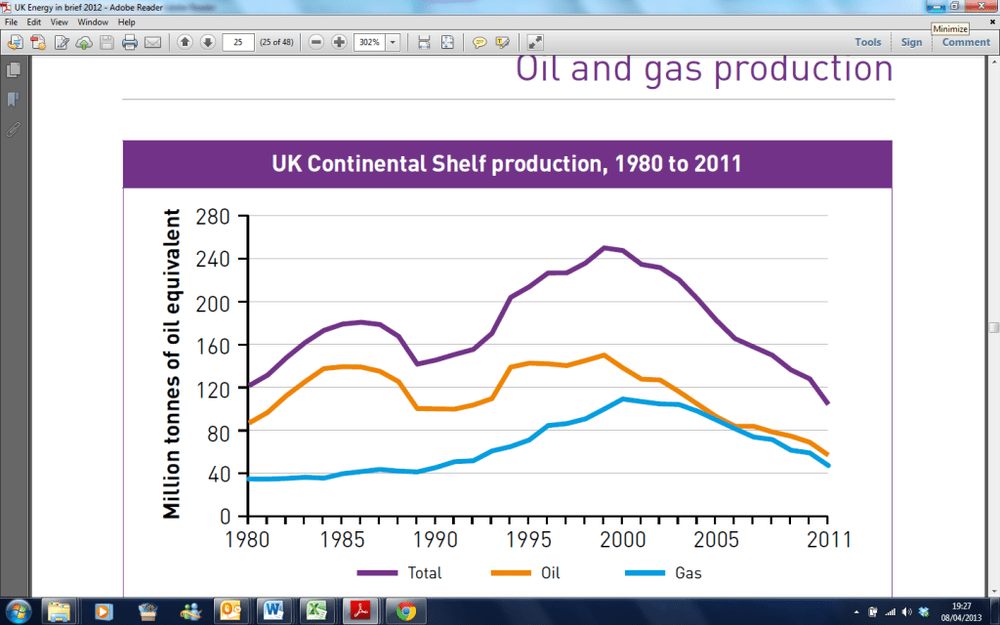
UK oil gas production 1980 to 2011
Inflating the private debt balloon
Financial liberalisation and deregulation had begun in the 1970s. However, the Big Bang and prioritisation of the City of London above the productive economy – the flagship policies of the Thatcher government – led to the start of the process of inflating the private debt balloon, that was to grow ever larger under the Major, Blair and Brown governments. It reached almost 500% of GDP before the gigantic balloon started to deflate with households and non-financial corporations ‘deleveraging’ slightly. This decision to reduce the productive sector and inflate the finance sector – started by the Thatcher government but maintained by her successors – is a strategic error of vast proportion.
Source: ONS & McKinsey, from UK Budget report

Private_sector_debt_uk
Inequality
Inequality worsened extremely rapidly under the Thatcher government period, from a relatively low level (in terms of Gini coeeficient) to a much higher level, where it has more or less plateau-ed or slightly risen until the present government. But the rise from 1979 to 1989 is truly remarkable. Here is the chart for the Thatcher, Major, Blair and Brown governments:
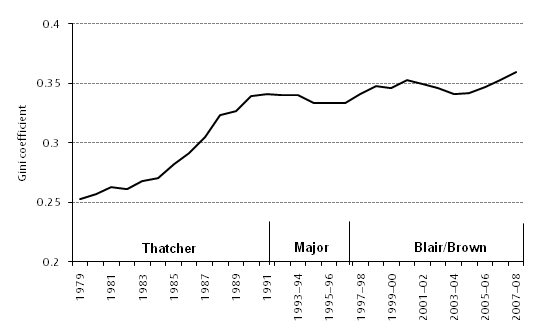
UK inequality Thatcher to Brown NS
Conclusion
Far from laying the foundation for future economic success, the Thatcher government caused the UK’s economic development to worsen in comparison with the previous period since the end of WW2. The productive base of the economy was weakened greatly, whilst the finance sector was let of the leash, ultimately with disastrous results. While some progress was made on inflation, by the end of Mrs Thatcher’s term of office in 1990, it was back almost up to 10%, while the UK’s trade balance and current account reached their worst ever points since 1945. Inequality was ratcheted up, and social divisions exacerbated. The British establishment’s outpouring of praise for the ‘achievements’ of the Thatcher government is out of kilter with the reality of its actual record.


2 responses
Good article – the Thatcher economic “success story” has been exaggerated – one ex Fleet Street editor (who is old enough to know better)described the UK before Thatcher as being like North Korea. I am old enough to have lived through the 1970’s and know this to be nonsense.I am not a Labour member or supporter.
Thank you for injecting some commonsense into this debate. She was not evil personified but neither was she some great saviour figure. She did untold damage to this country and through her close ties with the other economically illiterate government of the time, in the US under Reagan, to the world. We are now reaping the rewards. Blair, Brown et al also have grave responsibilities in this matter but in general they merely followed her lead.