

Today’s UK labour market statistics from ONS, mainly for the 4th Quarter of 2015 (Q4, October to December), appear on the face of it to be mainly positive – but there are a number of signs of a possible weakening, including in relation to pay (nominal and real) and unemployment.
Wages
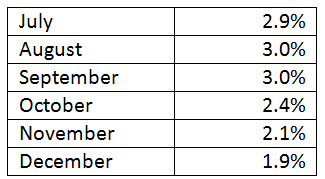
Given its importance to the development of the economy, the level of earnings has been watched particularly closely – and annual total pay rose in December by just 1.5%, the lowest annual rise since February (1.1%). The rolling 3 month average of wage rises (n.b. these figures do not include the self-employed) has been slowing for some time:
Manufacturing and (yes) finance and business total earnings have risen by less than the average, while pay in the retail, hotel and restaurant sector is rising faster at over 3%, and in construction, the annual pay increase has exceeded 6% for several months, reflecting the shortage of skilled labour (as well as years of depressed pay), it appears.
Looking at real pay (i.e. after taking inflation into account), the longer-term situation remains pretty dismal. Over the course of this year, and for the first time for several years, real pay has edged up a little – but in December more slowly than for some time (annual CPI inflation 0.3%, pay +1.5%)
Taking a 10 year look, we find that real total pay in Q4 2015 (i.e. including bonuses) was still a full 1.9% lower than Q4 in 2005 – lower than a decade ago! Of course, the job mix has changed in a major way, but this shows the long-term stagnation in pay that working people experience. Comparing total real pay in December with the peak period in early 2008, there is still an enormous 9% difference. Geoff Tily, senior economists at the TUC, has written today in the Touchstone blog about a “lost eleven years on pay, unprecedented for at least 150 years”.
Labour productivity
While we do not have direct detailed information on productivity, it is to be noted that the total hours worked in the economy rose by 1.6% in Q4, compared with the same Quarter in 2014. The annual change in GDP for the same period of comparison is estimated by ONS at 1.9%, so labour productivity measured as output per hour will be slightly (but only slightly) positive. The same will be true when measuring productivity as output per worker – since the number in employment (of some kind) also rose by around 1.6%.
Changes in employment and self-employment
Back to the rest of the employment picture. To look at some positives, the overall number of economically active for the whole 16+ workforce rose by 145,000 on the previous Quarter, and those in employment of some form increased by a big 206,000. For the 16-64 age group, the increase in the economically active was 115,000, and 172,000 in the number in some form of employment. The number of unemployed (16+) fell again, this time by 59,000. An odd feature is that the increase in this quarter was heavily skewed towards men, with 163,000 more men in employment, but only 42,000 more women.
The detail is a little more mixed. The increase in employment was split almost evenly between employees (+99,000) and the self-employed (+104,000). Most of the gain was in full-time employment – there were 120,000 more full-time employees than in the previous Quarter, and 77,000 more full-time self-employed. The number of part-time employees actually fell (by 20,000), while the part-time self-employed grew by 27,000.
Comparing at the Quarter with Q4 in 2014, we find that there were 521,000 more in employment, of which some 70% (380,000) were employees, and 30% (154,000) self-employed. There was a similar split between full-timers and part-timers, though some 300,000 of the new employees were full-time. The increase in self-employed split more evenly, at 87,000 (FT) to 67,000 (PT).
Is unemployment starting to rise?
On the face of it, the unemployment story remains a positive one. The unemployment rate (16+) stayed at 5.1%, which though fairly high by earlier standards, is lower than at any time since the financial crisis of 2008. The official figures for Q4 show a fall of 58,000 in the unemployed total compared to Q3.
But the way the ONS calculate both employment and unemployment figures for each rolling quarter is to take the monthly figures, which however are individually not deemed to be solid enough to be national statistics, and which are then averaged from the latest 3 months. (ONS will not agree with this poor explanation – do read their explanations if you wish to delve further into their methodology. But it is the case that 3 monthly figures are averaged to give the latest unemployment number and percentage).
The December 2015 figure shows an increase in unemployment of 115,000 over the previous month. It is averaged with the figures for October and November. To look at the overall pattern rather than month by month, here are the monthly figures (in thousands) for the last 6 months:


