
This is John Weeks’s contribution, on fiscal policy, to the EREP review of the UK economy 2015, “the Cracks Begin to Show”. The full report can be downloaded here
When he became chancellor in May 2010 George Osborne pledged to eliminate the fiscal deficit, to “balance the books”. In his first budget statement that summer he set a specific target, to borrow no more than £37 billion during fiscal year 2014/2015. That fiscal year ended on 31 March 2015, and borrowing for the fiscal year weighed in at a tidy £90 billion, which by simple subtraction yields an over-run of £53 billion.
The table below shows the major UK fiscal indicators for the latest available statistics, the 12 months ending 30 October 2015. Despite not meeting the target he set for himself, the chancellor has boasted of success because the overall fiscal balance (i.e. government revenues less spending) is now just over minus £50 billion compared to over £100 billion when he took over Britain’s public finances (borrowing and fiscal balance numbers in the table differ due to asset sales, almost all from bailed out banks).
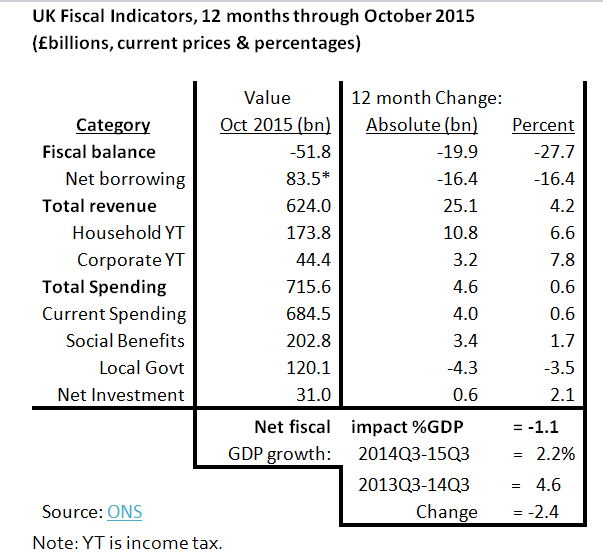
*In June 2010 Osborne announced an annual borrowing target of £37 billion for fiscal year 2014/15.
This heart-felt self-congratulation inspires scepticism for three reasons. First, the cost in human suffering of the fiscal “savings” has been enormous, felt most acutely through the devastation of local government services. Over the 12 months covered in the table, local government funding fell by over £4 billion or 3.5 percent of total spending by councils.
Though central government spending on social “benefits” (aka what we pay taxes for) increased slightly, adjustment for inflation and population increase renders the change close to zero.
Second, the reduction in the fiscal deficit and borrowing resulted from tax revenue increases not from cuts in spending. Total spending actually rose by £4.6 billion, outweighed by a revenue increase of £25 billion (almost all coming from household income taxes and VAT).
The implication of the second source of scepticism yields a third, that the budget cuts prevented a balancing of the books. A look at the chart below tells the tale. The fall in the deficit has been strongly linked with falls in the GDP growth rate (across the ten quarters a decline in the fiscal deficit of one percentage point was associated with a fall in GDP growth of 0.6 percentage points).
The causality is obvious. Tax revenues increase when GDP increases (and people’s income increases); cutting public spending reduces overall demand, depressing GDP growth. During the 12 months covered in the table the net overall effect of the chancellor’s fiscal policy was a negative 1.1% of GDP.
The depressing effect of fiscal policy shows in GDP growth itself, which declined in current prices by 2.4 percentage points during the 12 months through 2015Q3 compared to the previous 12 (2013Q3 – 2014Q3). The larger fall in GDP growth than the fiscal drag results from a slightly negative trade effect, slowdown in private investment, and the expenditure multiplier magnifying all three.
Changes in Treasury Net Borrowing (12 months)
and Nominal GDP Growth Rate 2013Q1-2015Q3
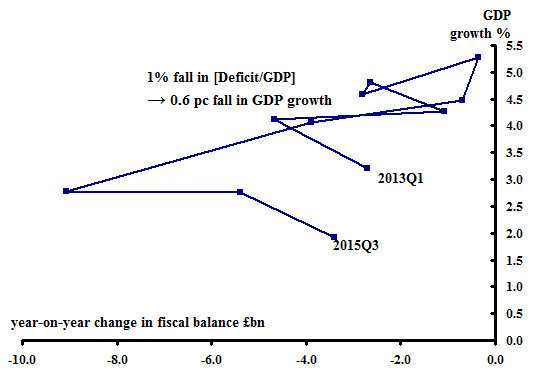
Source: ONS
A review of fiscal policy for 2015 shows what we should expect. The UK economy remains demand-constrained, and the Chancellor’s policies made that straitjacket ever tighter. We should compliment the chancellor for not achieving his £37 billion borrowing target for fiscal year 2014/2015. To have done so would have made a bad performance worse.