Policy Research in Macroeconomics

Europe’s trade in goods – smaller EU deficit, growing EZ surplus

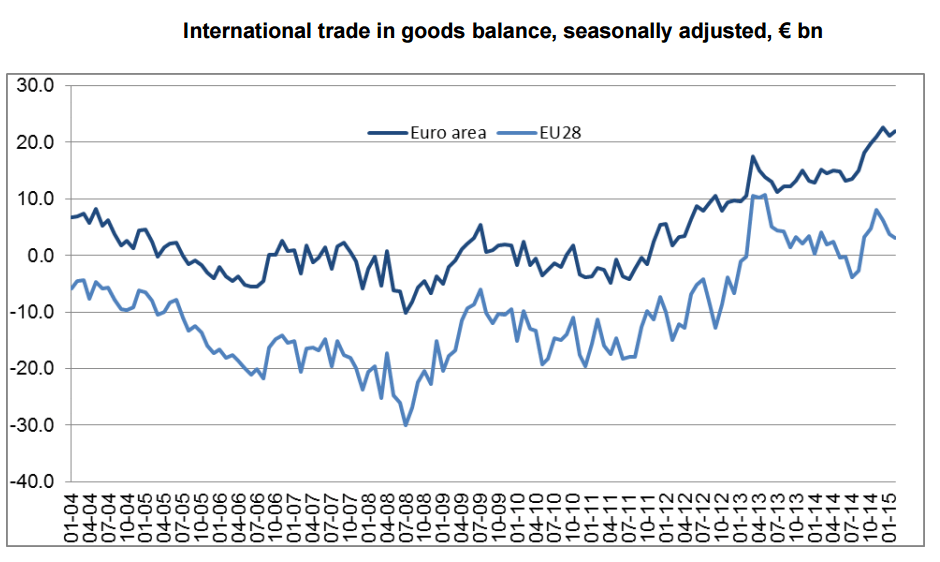
Eurostat today published its first estimate of the February 2015 trade in goods position for the EU as a whole, and for the 19-country Eurozone.  In February compared with January 2015, euro area seasonally adjusted exports increased by 2.8%, while imports increased by 2.6%. The seasonally adjusted balance was +€22.0 bn, an increase compared with January (+€21.2 bn).  Not seasonally adjusted, the balance was €20.3 bn.  

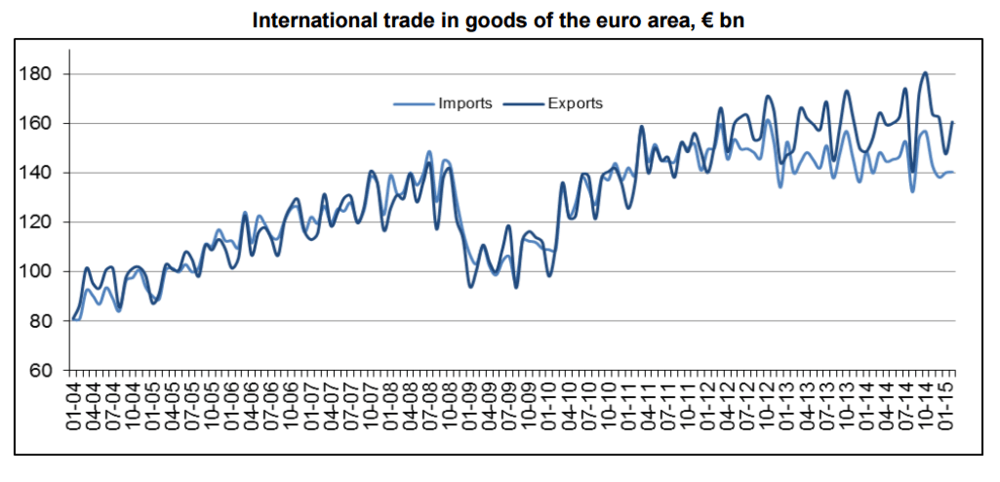
The following Eurostat chart shows the international (i.e. beyond EZ) trade of the Eurozone, with exports and imports shown.  Note that until 2012, exports and imports were broadly in balance.  This in effect meant that Germany’s large surplus was matched by extra-EZ trade deficits in other EZ countries.  However, since 2012, the position has shifted with the EZ being in large surplus to the rest of the world (including UK).


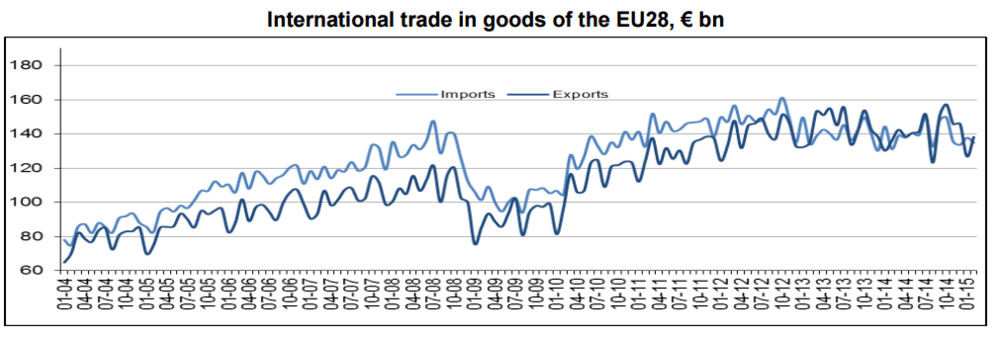
The next chart looks at the EU28’s imports and exports to/from the rest of the world – and shows that until 2012, the EU was permanently in deficit.  Since then, however, imports and exports have been much nearer to balance on a regular basis.  The EZ ‘rest of world’ surplus is therefore matched by the ‘rest of world’ deficit of the UK and other non-Euro EU states.


Trade in goods EU international feb 2015.PNG

Taking January and February together (but not seasonally adjusted), the Eurozone (EZ) had a surplus (relative to the rest of the EU and rest of the world) of €27.9 bn, while the EU had a smaller deficit (with the rest of the world) of €7.5 bn.  Compared with the same 2 months last year, the EZ nearly doubled its trade in goods surplus (from €14.5 bn) and the EU reduced its trade in goods deficit by a quarter, from €9.4 bn.

PRIME has a general rule of thumb that Germany’s trade in goods surplus is equivalent to the trade deficits of the UK and France, and this nearly holds for this 2 month period.  Germany’s surplus is estimated at €35.6 bn, while the UK’s deficit is €28.2 bn, and France’s €9.7 bn.

Intra-EZ trade fell to €267.1 bn in January-February 2015, -2% compared with January-February 2014.  Exports by EZ states outside the zone for this period rose by 2% year on year, while imports from outside the EZ fell by 3%.

The following chart, from Eurostat, shows the evolution of the international trade in goods balance since 2004 for both EZ (to rest of EU and world) and EU (to rest of world).


It will be seen that the EZ was broadly in balance, before and during the financial crisis, till the eurozone crisis of 2012, but has since then seen an ever-growing surplus.  The position for the EU as a whole is that its large trade deficits in the period to 2012 progressively reduced, and is now broadly in balance. 

Leave a Reply

Your email address will not be published. Required fields are marked *

This website collects cookies and analytic data. To use our website you must consent.
For more information read our Privacy Policy.