Policy Research in Macroeconomics

UK national output per (available) worker: back to 2003 level

By Jeremy Smith

Today we learn from the Office for National Statistics that 2.5 million were still unemployed in the last quarter of 2012. The UK economy is failing to use the skills and resources of our people to best effect in the common interest. This is to a large extent because the government’s economic policies are wrong.

With 2.5 million still unemployed, the problem is that we have a shrinking economy, largely because we have failed as a nation to invest in our future, and are trapped in the downward spiral of austerity and lack of vision.  We still have perverse economists who argue, in the teeth of the evidence, that the public sector is ‘crowding out’ the private sector – and this at a time of high levels of private sector debt and mass unemployment!

No wonder we cannot invisible-handedly create the goods and services and income required to ‘deleverage’ these high levels of private debt.  We need government to take the lead in a massive programme of investment to create the basis of a new, sustainable economy.

Productivity falling

The stark truth is that – despite a working age population that has grown continuously – the overall economic value (GDP for short) that we are producing has hardly grown since 2006, and has fallen since 2007.  The ‘value of GDP per worker’ is below the level of 2004.

Worse still, the ‘value of GDP per member of the whole workforce’ – employed plus unemployed – has crashed by 6.72% since the peak of 2007.  And since 2003, on this indicator we have made no progress whatsoever.  We produce the same value per workforce member as we did 9 long years ago.  This is because we are wasting the potential of over 2 million people.

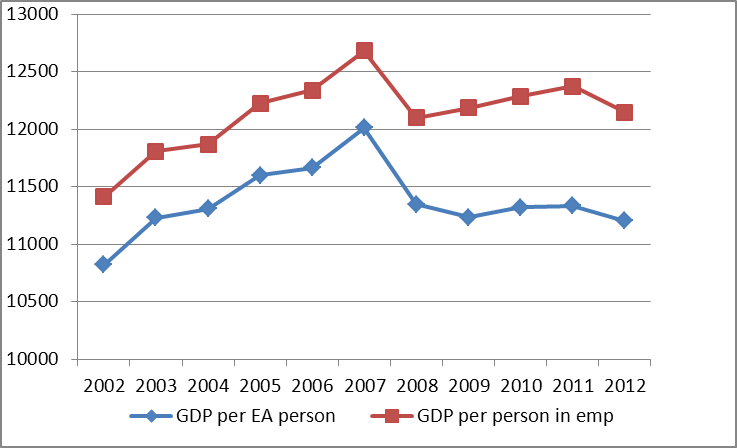
Chart 1 – GDP £ per economically active person and per person in employment

GDP per econ active

In our recent report, “Ailing economy, failing solutions”, we said

  • Traditional productivity methodology has a fundamental flaw when it comes to measuring the performance of a national economy with a high level of unemployment. This is because productivity methodology ignores the wasted capacity of a nation’s economically active, but unemployed, population

  • In effect, traditional productivity methodology implicitly assumes that there is no unemployment, or that by reducing the volume of labour per unit of output, the displaced employees will quickly be more productively employed elsewhere in the economy – which is not borne out by reality

We therefore argued that by far the most significant high-level measure of productivity for a national economy is the value of ‘output’ (represented by GDP) divided by the “economically active” population, i.e. the sum of those in employment and those unemployed but seeking work.

 The waste caused by unemployment

We have looked at the data for the decade from 2002 through to 2012, and Chart 1 at the head of this blog shows the difference between GDP per person in employment, and GDP per ‘economically active’ person. For this we have taken the GDP in the 4th Quarter of each year, and the number of economically active etc. from the September to November figures for each year, which is the latest period we had for 2012. While these periods do not map perfectly, they are very close and give an authentic picture.

The gap between two lines in effect represents the waste caused by unemployment.  It will be seen that the difference is much wider post financial crisis from 2008.  Also, that while GDP per person in employment rose slightly from 2008 to 2011 (before dropping badly in 2012), GDP per economically active person (i.e. including the unemployed) remained virtually unchanged from 2008. No increase over 5 long years, and similar too to the levels of 2003 and 2004.

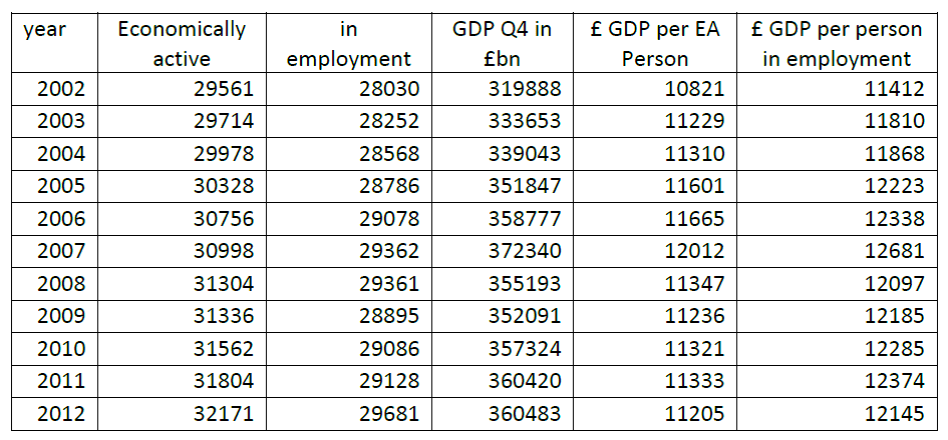
Here are the data in tabular form:

19 feb table Prime article

Note that the number of economically active has grown in each year, while the number in employment rose then dipped before rising again rapidly in 2012. Chart 2 shows the evolution of each (in 000) over the decade.

Chart 2

Chart 2

This big increase in numbers in employment in late 2012, in tandem with stagnant GDP, means that GDP per person in employment has fallen back to £12,145 – the lowest since 2004.  As stated at the start of this article, it is 4.23% below the level of late 2007. Moreover, the GDP per economically active person, at £11,205, is the lowest since 2002, and 6.72% below the late 2007 peak.

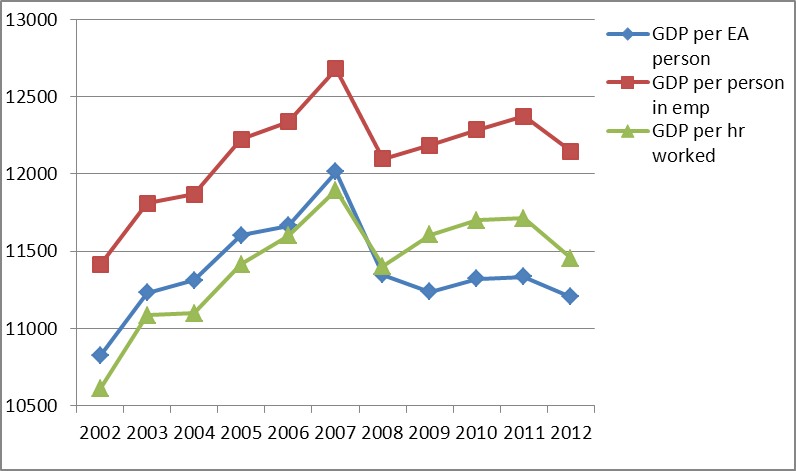
Since the number of those in employment does not precisely capture the time spent working, we have also looked at the classic macro-level productivity indicator, GDP divided by hours worked. The picture is very similar indeed and thus confirms the general validity of the above conclusions.

Chart 3

Chart 3

And in chart 4, we map GDP per 30 hours worked (n.b. different y axis data but same pattern) against the previous two lines in Chart 1:

Chart 4

GDP per Econ Active and hr worked final

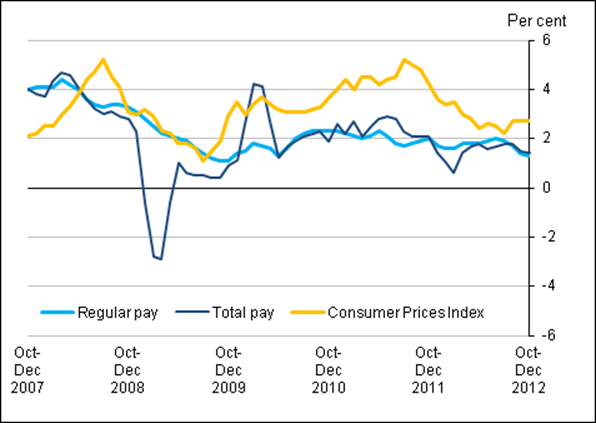
All this needs to be seen in the light of the fact that real wages have been and are falling, even compared to the CPI let alone RPI inflation index.  We in PRIME were among the early birds in pointing out that the so-called productivity puzzle is in reality largely due to falling real wages – in August and September 2012.  Here is ONS’s latest chart which shows that not only regular pay but total pay has fallen below inflation, for almost the whole period from 2008.

Chart 5

Chart 5 real pay

Recent discussions on the impact of ‘robots’ on future employment have started to raise interesting questions on how far improvements in productivity which reduce human employment levels is ‘a good thing’ , and how far we can adjust happily to a new leisure-based society. We in PRIME are fairly fond of our leisure; but in the absence of a more just, economically equal and sustainable society, we are convinced that, for the coming decades, involuntary unemployment and under-employment are neither positive nor necessary.  We have to find policy responses which favour employment for all, and promote and deliver productive, sustainable economic activity.

3 Responses

  1. Frances,
    All very noble.

    Unfortunately it falls into the progressive trap of believing that everybody is a self-starter. They are not. A great many, if not the majority, have to be directed and like being directed.

    As Mrs Doyle would say ‘some of us like drudgery’.

    Basic income can’t work because you then have no way of ensuring that needed production happens.

    The market has failed to spontaneously provide an income. It is most unlikely that it will spontaneously provide a standard of living either.

    The state has to reserve the right to require output in return for its scrip.

  2. Neil, I’m not convinced that state-provided drudgery is any better than drudgery provided by the private sector as a cheap alternative to automation. Personally I would prefer a citizen’s basic income and encourage people to do a huge range of things, paid and unpaid, that they find personally fulfilling and that benefit society as a whole.

  3. Policy responses that use people to perform a job when a machine could do it (hand car washes anybody) are very wrong. Crowding out mechanisation is not the way forward.
    Let the private sector mechanise. More than that, force them to mechanise by making sure they pay the full cost of labour. And any labour that is spare should be purchased by the state at a fixed price and deployed for the public good.

    For me that is the most virtuous of circles. Increasing common goods that the private sector can exploit. Increased mechanisation to get rid of drudgery and yet everybody is still engaged productively with sufficient income.

    We know how to make this happen. So let’s do it.

Leave a Reply

Your email address will not be published. Required fields are marked *

This website collects cookies and analytic data. To use our website you must consent.
For more information read our Privacy Policy.