

In this article, we show that the post 1997 Labour government on average spent a lower percentage of GDP than the preceding and following Conservative(-led) governments. Deficits have on average been considerably greater under Conservative governments, which however cover more years of economic weakness.
The Chancellor’s current proposal for mandatory and permanent budget surpluses serves no useful economic purpose for the people of the UK, but may serve his own transient political ends.
Executive summary:
Despite the rise in public debt since 2008/09, there has been no significant rise in the UK’s debt interest repayments as a percentage of GDP; they have remained at a historically normal level. The level of net debt as a percentage of GDP is still far below the level that the UK has had for much of its history since the 19th century.
- As a percentage of GDP, public spending has undulated according to circumstances; both Conservative and Labour governments (as necessary) spend a higher proportion of GDP in times of economic or financial crisis.
- Overall, Labour governments have tended on average to spend a lower percentage of GDP.
- All governments have run overall and current budget deficits almost every year, but mainly of modest size except at times of economic or financial crisis.
- Deficits have on average been considerably greater under Conservative governments, which however cover more years of economic problems.
- During the years from 1998/9 to 2000/01 the Labour government ran overall budget surpluses, even taking investment spending into account, and the consequence was a low and inadequate level of net capital investment in the country’s physical infrastructure.
- For the Major government years, the total deficit sum in 2011 prices was about £230 billion over 6 years (average £38 billion per year), and for the Labour government around £240 billion over 13 years, including the peak crisis year of 2009/10, (average £18.5 billion per year).
A “vacuous and irrelevant” proposal?
We were told, ahead of Mr Osborne’s recent Mansion House speech, that the Chancellor was going to announce his proposal to outlaw budget deficits by legislation. Indeed, the Financial Times carried an editorial published the next day criticizing the idea of using law:
His plan to create a legal requirement for governments to run a budgetary surplus is primarily a piece of political positioning. It will do little to keep the UK’s credit safe.
The FT rightly reminds us, however, that it was Gordon Brown’s Labour government that foolishly started this nonsense with the so-called Fiscal Responsibility Act 2010 which included the following injunctions:
(1) The Treasury must ensure that, for each of the financial years ending in 2011 to 2016, public sector net borrowing [as a % of GDP] is less than it was for the preceding financial year.
(2) The Treasury must ensure that, for the financial year ending in 2014, public sector net borrowing [as a % of GDP] is no more than half of what it was for the financial year ending in 2010.
(3) The Treasury must ensure that (a) public sector net debt as at the end of the financial year ending in 2016 [as a % of GDP] is less than (b) public sector net debt as at the end of the previous financial year…
And the FT reminds us further,
As soon as he took office Mr Osborne repealed the law, having previously called it “vacuous and irrelevant”. And rightly so. Had he not done, it would have forced him into further austerity in 2012 and 2013.
We fully agree – the law cannot and should not prescribe economic outcomes, or in the attempt to do so, it may make matters worse. But in our hope that the new Labour leadership will refuse to walk into Mr Osborne’s trap, we need to recall that Labour has ‘form’ in this area.
In fact, the actual Mansion House speech made no specific mention of legislation, instead using this opaque formulation:
The result of this recent British election – and the comprehensive rejection of those who argued for more borrowing and more spending – gives our nation the chance to entrench a new settlement that… in normal times, governments of the left as well as the right should run a budget surplus to bear down on debt and prepare for an uncertain future.
In the Budget we will bring forward this strong new fiscal framework to entrench this permanent commitment to that surplus, and the budget responsibility it represents.
This fiscal framework will be voted on by the House of Commons later this year, and assessed by the Office for Budget Responsibility we created.
This does not exclude the possibility of legislation, but gives plenty of wriggle room for other “solutions” – and if the Chancellor intends to introduce legislation, why not be explicit about it, rather than waffle about entrenched frameworks? Especially as it is notoriously difficult to “entrench” anything under the UK’s non-constitution. It seems he may still not be so sure that legislation is the only or best way…
Mr Osborne’s indictment
But let us turn to the substance, and examine the main charges in Mr Osborne’s indictment of Labour (or indeed other parties to the left of Labour). The main ones are these
• Labour is the party of more borrowing and more spending
• Labour ran deficits even in the good times before the financial crisis, which meant the crisis was far more serious
We look first at spending.
Public sector current expenditure since 1979 (excluding capital spending)
• Under Mrs Thatcher’s first government, public sector current expenditure rose from the 38% of GDP in 1979 to 42% in 1981 to 1983 – and remained over 40% till 1986.
• Under the Major Conservative government, current expenditure rose from 35% (1990/91) to 39% of GDP in 1993/4/5
• The incoming Labour government in 1997 inherited a level of 37%, and current expenditure remained at or below this level until the crisis began to hit in 2008/09.
• The incoming Coalition government inherited a current spending level of 42% of GDP, i.e. just under the Thatcher government peak, and it remained at over 40% until 2014/15.
Total Managed Expenditure (TME), i.e. including capital investment spending [1]
• The peak level of Total Managed Expenditure since 1979 was 48.1% of GDP under Mrs Thatcher’s first government in 1982/83
• TME was over 40% of GDP in 14 of the 18 years of Conservative government from 1979 to 1997
• TME was below 40% of GDP for the first 7 years of the Labour government, and at 40% for the next 4 years.
• TME peaked under the Brown government in 2009/10 at 47% of GDP (but still below the peak level under Mrs Thatcher); under the Coalition government TME reduced from 46 to 43% of GDP in 2014/15
Our conclusion: as a percentage of GDP, public spending has undulated according the circumstances; both Conservative and Labour governments (as is necessary) spend a higher proportion of GDP in times of economic or financial crisis. Overall, Labour has tended on average to spend a lower percentage of GDP.
So let us turn to deficits and debt, including point 2 – the alleged failure to “fix the financial roof” while the economic sun was shining.
25 years of budgets, deficits, surpluses and debt
Since 1990/91 there have been 12 financial years of Conservative or Conservative-led governments (including 2015/16), and 13 of Labour governments. Here is a statistical summary of their respective fiscal outcomes:
• Of their 12 years, Conservative or Conservative-led governments have had NO year in which the overall budget deficit was less than 3% of GDP. [0%]
• Of their 13 years, Labour governments had 9 in which the overall deficit was under 3% of GDP. [69%]
• Of their 13 financial years, Labour governments had 5 in which there was no current budget deficit as a % of GDP. [39%]
• Of their 12 years, Conservative or Conservative-led governments have had NO year in which there was not a current budget deficit. [0%]
• Of their 12 years, Conservative or Conservative-led governments have had 11 in which the current budget deficit was higher than 2% of GDP. [92%]
• Of their 13 years, Labour governments had just 3 in which the current budget deficit was higher than 2% of GDP, including the last two financial crisis years. [15%]
• From 1997/8 to 2007/8, the average current budget deficit under the Labour government was just 0.1% of GDP per year.
Our conclusion: All governments have run overall and current budget deficits almost every year, but mainly of modest size except at time of economic or financial crisis. Deficits have on average been considerably greater under Conservative governments, which however cover more years of economic problems.
During the years from 1998/9 to 2000/01 the Labour government ran overall budget surpluses, even taking investment spending into account, and the consequence was a low and inadequate level of net capital investment in the country’s physical infrastructure.
Did the Labour government allow debt and debt interest payments to snowball?
• Debt as a percentage of GDP was 39% in 1996/97, and was 37% of GDP in 2007/08. There was therefore no major increase in net public sector debt under Labour prior to the financial crisis (which was caused by excessive private sector debt)
• During the financial crisis, under successive governments, debt as a percentage of GDP rose from 49% in 2007/08 to 62% in the peak crisis year 2009/10, and to 80% in 2014/15
• The new Labour government in 1997 inherited debt interest payments at 3.3% of GDP; when it left office in 2010 this was 3.0% of GDP, peaking a year later 3.1%.
• Under the Major government, average annual debt interest payments were 3% of GDP. Under the Labour government, debt interest payments on average (including the crisis years) were 2.5% of GDP
Our conclusion: Despite the rise in public debt since 2008/09, there has been no significant rise in the UK’s debt interest repayments as a percentage of GDP; they have remained at a historically normal level. The level of net debt as a percentage of GDP is still far below the level that the UK has had for much of its history since the 19th century
The statistics
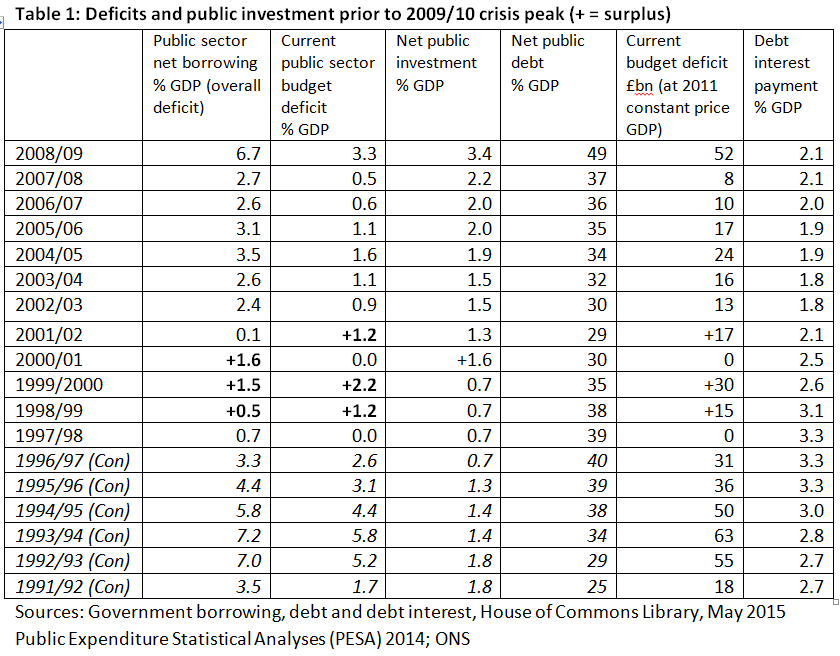
In table 1, we set out budget deficit/surplus and investment levels as percentage of GDP from 1993/4 to 2008/9. This table shows a normal pattern before the exceptional peak deficit year of 2009/10 arising from the financial crisis.
The table gives for each year the overall deficit, net investment, and current budget as percentages of GDP. The current budget deficit is calculated here as the difference between the overall deficit and investment spending percentages.
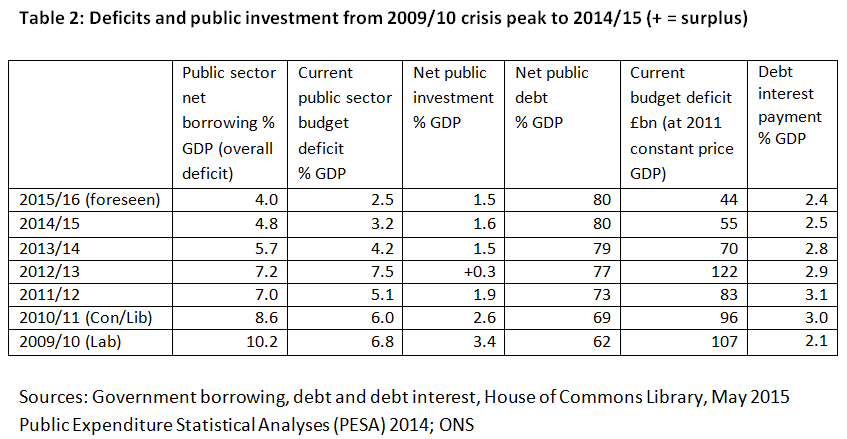
Table 2 covers the same information, but for the more recent period since the peak of the crisis in 2009/10.
In both tables, we look at
(a) The overall budget deficit or surplus as a % of GDP
(b) The current budget deficit/surplus as a % of GDP, which we have taken as (a) minus (c)
(c) Net investment as a % of GDP
(d) Net public sector debt as a % of GDP
(e) Debt interest payments as % of GDP, and
(f) Our broad estimate of the amount of the deficit (or surplus) on current budget in billions of pounds, using constant 2011 prices for like-for-like comparison


2 Responses
Jeremy, if you assume each government’s first year in office is an inherited budget and re calculate the series running from the second year in office and one year after leaving office, does the picture materially change?
" During the financial crisis, under successive governments, debt as a percentage of GDP rose from 49% in 2007/08 to 62% in the peak crisis year 2009/10, and to 80% in 2014/15"
Should that not be 2008/9?