

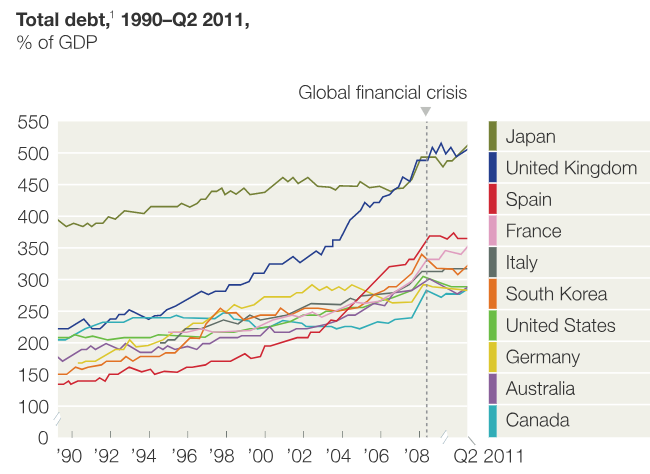
Ten years on from the full explosion of the Great Financial Crisis in autumn 2008, and Brexit lurking just round the corner…
A lot of the Brexit arguments revolve around the perceived pros and cons of the EU’s Single Market; meanwhile, President Trump has been using force majeure to overturn aspects of the 1994 NAFTA deal.
Given this conjuncture, I thought it would be instructive to take stock and assess, over a longer time-frame, how the UK and other developed economies have performed from an overall macroeconomic perspective.
To do this analysis, I have taken a group of ten “developed economies”, comprising the G7 plus three northern European countries, Denmark, Sweden and the Netherlands, and compared them since 1971, when the OECD dataset begins, in terms of the annual rate of change in real GDP per head of population. (Coincidentally, 1971 was also the year President Nixon broke up the Bretton Woods system by de-linking the dollar from gold).
Are there provable “gains from trade agreements”?
One issue that particularly interests me is whether – from the data – one can see any discernible impact of the EU’s Single Market (which formally began in 1993) or of NAFTA (which came into effect in 1994). That is, can we see from the GDP data whether modern trade (and related) agreements really have, as their proponents argue, a positive impact for all signatories? I have therefore looked at the data over two “eras” – the pre-SM/NAFTA era up to 1992, then the period from 1993 to 2017.
Back in 1988 the Cecchini report was commissioned by the European Commission to assess the economic impact of the forthcoming Single Market. It concluded:
“The total potential economic gain to the Community as a whole is estimated to be in the region of ECU 200 billion or more expressed in 1988 prices. This would add about 5% to the Community’s gross domestic product…”
And while a report from Deutsche Bank in 2013 “The Single European Market 20 years on” concluded that the SM had only added around 2% overall to the EU’s “income”, in 2014, the European Parliament’s Research Service published a report, “The cost of non-Europe in the Single Market”, or “Cecchini Revisited” , in which they claimed (with brazen implausibility) that
“In its twenty years of existence, the European Single Market consisted is estimated to have raised GDP by 5%. When dynamic effects are factored in the measurable effect can be seen to rise significantly.”
Well, I’m assuming this meant that the extra 5% (plus more) would come on top of the average pre-existing trend rate of increase, otherwise there would be no added benefit to be seen from the Single Market.
As regards NAFTA, the impact on the US economy was predicted at the outset to be very modest, as reported in this 2001 article in the Journal of Economic Perspectives:
“At the time of the NAFTA debate, studies suggested that Mexico would bear more of the adjustment than would the United States or Canada. For example, the Congressional Budget Office (1993) forecast that Mexico’s economy could increase 6 to 12 percent, or even more, by the end of the NAFTA transition period. In contrast, it predicted the U.S. economy would increase by about one-fourth of 1 percent in the long run due to NAFTA.”
From that one might have guessed that the US economy would proceed post-NAFTA at the same sort of trend rate as it had before, maybe a tad faster. But not a lot slower.
So let’s look at what the actual GDP per head data show – taking the period up to 1992, and then the Single Market / NAFTA era, from 1993 to 2017 – and see if we can detect any impact.
Comparing GDP per head
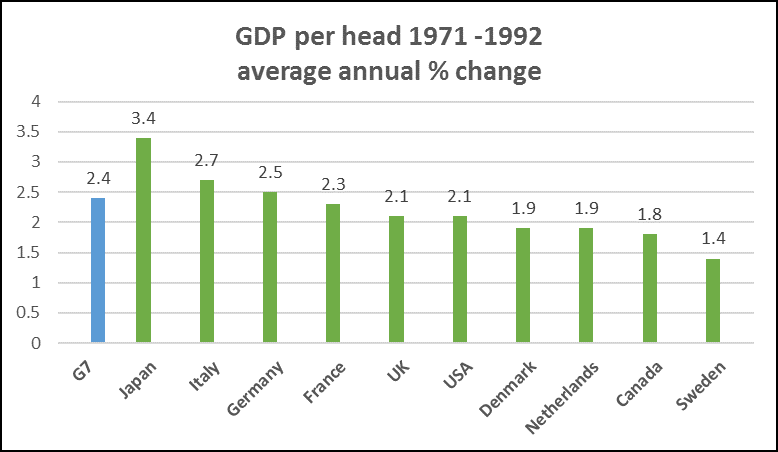
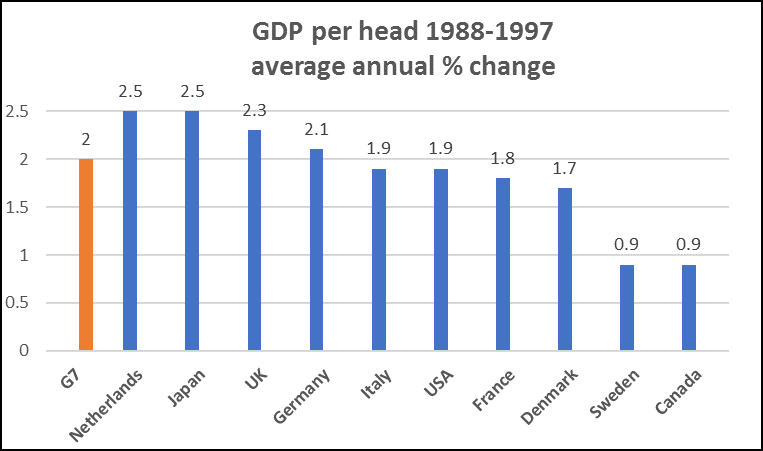
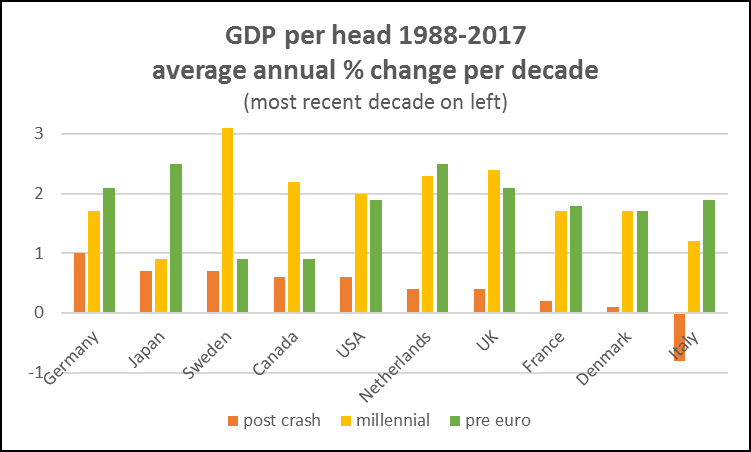
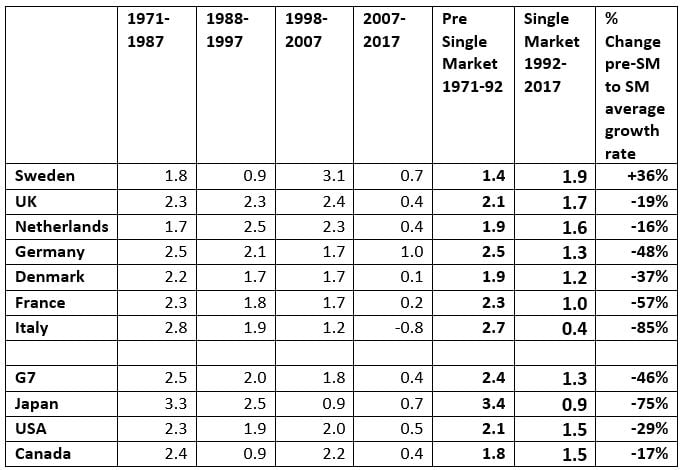
For the pre-Single Market, pre-NAFTA period up to 1992, we see that the countries whose GDP per capita rose most rapidly were Japan and Italy, followed by Germany and France. The UK and USA (2.1% average annual change) were middle runners, while Sweden and Canada languished. The G7 average for the period was 2.4%.
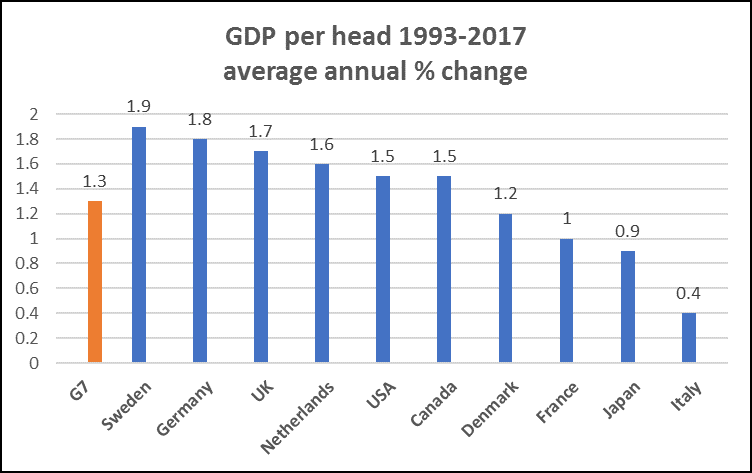
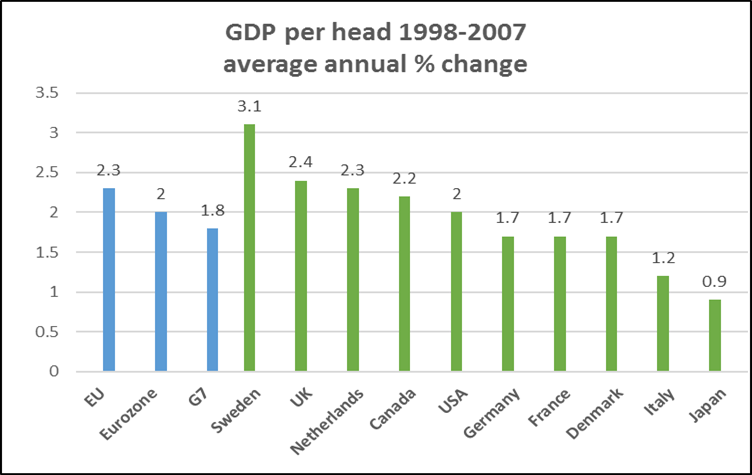
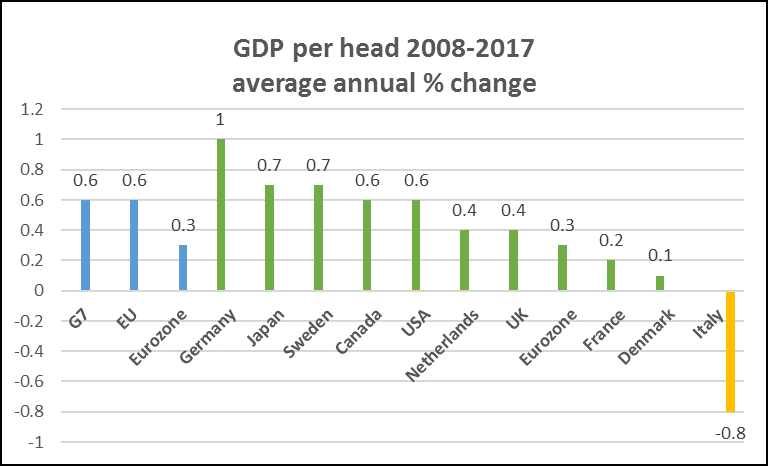
For the period 1993 to 2017, the picture changes dramatically. Italy and Japan drop to the bottom of the league table, while Sweden – which joined the EU in 1995 after its own banking crisis of 1992 – rises to the top, followed by Germany and the UK. Italy’s annual average change is a miserly 0.4%. No country sees its GDP pre head rise, over this long period, by 2% or more on average, while the G7’s average, falls from 2.4% previously to 1.3%, dragged down by Italy and Japan, but with France also much lower.
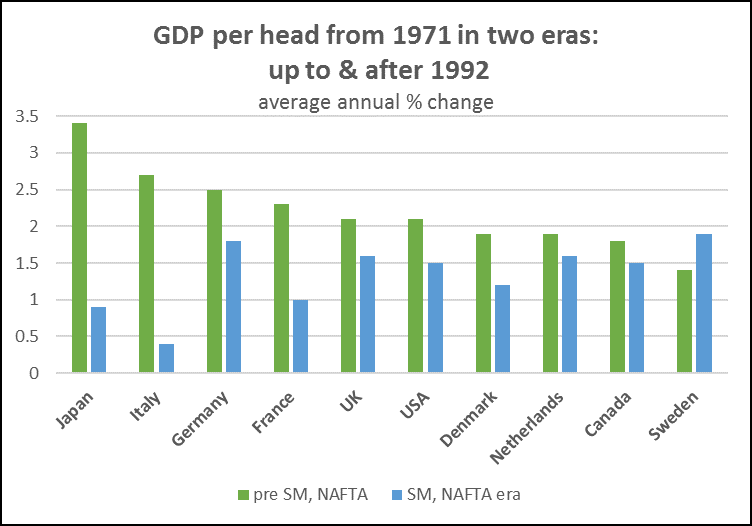
In the absence of a counter-factual, we cannot diagnose simply from the data what would have happened absent the Single Market and NAFTA. But we can state with certainty that the era of the Single Market and NAFTA has seen a very marked fall in the average annual rate of increase of GDP per head of population.


4 Responses
I’ve copied these 2 comments from Brave New Europe’s, who reposted your (excellent) piece the second is from me, but as it links to the first I’ve copied them both and I’m interested in your replies to all the issues raised.
Wilfrid Whattam says:
October 16, 2018 at 9:52 pm
Jeremy, thank you for sense. Like John Week, you are an antidote to all the scaremongering economic blather from the Guardian and a host of others – not least sadly within the Labour Party itself.
However, what is this serious geopolitical concern that you have? Ann Pettifor seems to have similar worries. Yet where are these concerns spelled out? If they are so worrysome, than let us see the reasoning. Is it just a nebulous fear, or have you got substantive reasons that could convince cautious (I like to think – even thoughtful) Brexiteers such as myself.
Adrian Kent says:
October 17, 2018 at 10:59 am
In addition to Wilfrid’s comments I’d be interested to know why you foresee no economic benefits [of leaving the Euro]. Are you assuming perpetual Tory/neoliberal government?
To raise just one opportunity, both the SM and NAFTA involve the FoM of Capital – curtailing this ‘right’ could have hugely significant positive effects (on redistribution, volatility, rent-extraction, tax-avoidance etc).
You have partially answered my comment in your reply to Danny’s, but I don’t think the implementation of the necessary macroprudential rules will be at all possible when any effected corporation could delay or destroy efforts by crying off to the ECJ (whose past performance suggests they’ll be only too happy to concur with capital). Remember too that the EU that was on offer in the referendum was one with significant (but unspecified) City opt-outs negotiated by David Cameron.
I’m really not convinced that you can usefully assess performance just on GDP growth, it’s such a crude measure hiding all sorts of economic imbalances. I think consideration of the political effects of the single market is perhaps more pertinent at this time. Fundamentally the four freedoms are not equivalent or balancing: as it stands, capital can be transferred internationally at the tap of keyboard, labour however has, and will always have, geographic and cultural ties. This fundamental difference means unrestricted flows of capital will always have the opportunity to exploit labour – this is the unacknowledged flaw at the heart of the single market.
Danny, agreed that it is simply the first step in any fuller analysis – and to note I looked at GDP per head, not GDP alone. I hope (when time permits!) to look at other indicators. And agreed, the unrestricted flows of capital are likely to destabilise as well as exploit – unless there are very strong macroprudential powers in place which almost have equivalent effect to capital controls.
Gains should also be compared to tariffs removed. The (financial) gains from free trade should correlate to the reduction in tariffs. As tariffs become lower over time diminishing returns might be expected. Free Trade has changed from reduction of tariffs to harmonisation of trade rules and shift from sovereign laws resolving international disputes to international arbitration