Image with acknowledgment to https://www.flickr.com/photos/birminghammag/6798098618/in/photostream/
In his FT article yesterday (30 January), “The UK’s employment and productivity puzzle”, Martin Wolf says
“The most important point is that the aggregate productivity performance of the UK economy since the financial crisis of 2007-08 has been its worst by far since 1860”.
The key questions, however, are why this is so, and what to do about it.
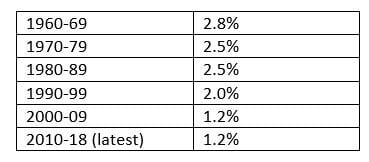
The ONS statistics do not take us back to the 1860s, but only to 1971. We have calculated the average percentage quarterly change in labour productivity (output per hour) by decade:
This is broadly in line with the Royal Statistical Society’s highlighting as its “statistic of the decade” that UK productivity has risen by just 0.3% per year since 2010.
From this table it appears that the rate of change in productivity was pretty constant over the 1970s, 80s and 90s, slowed in the 2000s, and has almost stagnated since then.
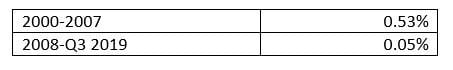
However, the picture becomes clearer – and more recently worse – if we divide the period from 2000 into two parts – before and since the Great Financial Crisis, taking Q1 of 2008 as the start date for the latest period. Here are the figures for the average quarterly change on this basis:
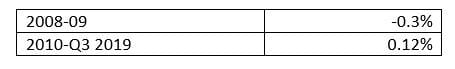
The post 2008 period can also be divided and seen in this way:
The earlier period from 2000 to 2007 therefore closely matches the earlier decades, while the period from 2008 has seen labour productivity move at a glacial pace..
Productivity slowdown coincides with austerity
Our thesis has long been that the austerity policies of the Cameron and May governments are key to the very poor performance of the UK economy – including the fall in productivity – since 2010. In the four quarters 2009 Q3 to 2010 Q2, before austerity policies kicked in, productivity rose in each quarter, at an average rate of 0.5% per quarter.
But once the Coalition government came to power and went for austerity, in the form of a long-term freeze on real public spending, the economy lost momentum. And remember that a real-terms freeze is a reduction in spending per head of a population growing at about 0.7% per year.
The chart below demonstrates the sudden shift. In both Total Managed Expenditure (which includes capital spending), and in current public sector spending, from 2010 till 2019 a virtual freeze has been enforced – uniquely in post-war history. It has severely damaged the economy and undermined social cohesion.
Source: OBR databank
Has GDP per head really risen “significantly”?
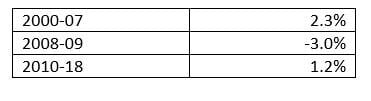
Martin Wolf goes on to claim, in his FT article, that despite stagnant real wages, “real GDP per head is up significantly”. This is a curious claim, depending on his definition of “significantly”. If we look at the UK data for annual average percentage change in GDP per head per decade, we find this:
From this, it would seem that the slowdown in GDP per head began well before 2010. However, if we take out and account separately for the two main financial crisis years, we find the pattern for GDP per head is very similar to that for productivity:
In other words, the early part of the 2000s followed the general trend of earlier decades, until the crisis broke. Since then, GDP per head has grown at around only half its earlier rate.
Austerity and poor productivity – cause or simply correlation?
Is the relationship between near-stagnant labour productivity, low increases in GDP per head and austerity (reduction in real terms public spending per head) simply a correlation, or is there a causal nexus?
We argue for a causal nexus. Back in 2015, Geoff Tily of the TUC (and longstanding PRIME contributor) already argued this case – see e.g. his article in the New Statesman (5 March 2015) “There’s no productivity puzzle: it’s the consequence of austerity”. Step 1 – austerity has led to a slowing in economic activity; step 2 – the labour market responded by cutting real wages; step 3 – as employment held up and later increased despite the slowdown, the logical consequence is low productivity. The main answer, to solve the problem, is to increase demand. Supply-side measures (better training etc.) are necessary but not sufficient. Geoff Tily summed it up nicely :
“The experts on whom the media rely and shape the economic and political debate, have let the government off the hook. The real villain, austerity economics, has not even been put on trial in the case against weak productivity. In the meantime the living standards of the many have been hammered.
What is worse is that this error leads to a fundamental policy error. Arguing that we can only have growth and better living standards as a result of productivity increases gets the argument exactly the wrong way round.”
What is somewhat dismaying is that – here in 2020 – Martin Wolf’s FT article is still titled “The UK’s employment and productivity puzzle”. There’s no puzzle. It simply needs a government willing to reverse the trend of austerity more strongly than Johnson and Sajid Javid aim to do. Given the economic downsides of Brexit, a domestic boost to demand is vital.
What we’re promised, however, is very modest – a 1% of GDP increase in spending, but with a “fiscal rule” to achieve a balanced current budget, and orders to ministers to look for 5% cuts :
“We can’t run an overdraft forever on day-to-day spending, so I can confirm that our first rule will be to have a balanced current budget. What we spend cannot exceed what we bring in.” (See Politico 30 January)
It looks as if GDP will have increased in 2019 by only around 1%, which means the change in GDP per head will again be very low (say 0.4%). With (post-)Brexit uncertainties on future trade and investment still swirling around us tis year, a 1% of GDP (£20bn) increase in public spending will do little to boost the economy, promote the transition to the post-carbon economy, or improve productivity. Government – and Opposition – need to develop strategy on a grander scale, if the UK’s challenges are to be met.