Policy Research in Macroeconomics

Euro-fission contest hots up – GDP, trade, employment diverge

Today’s GDP figures from Eurostat and several national ministries, following trade and (un)employment figures, show more clearly than ever the centrifugal force of the European crisis.

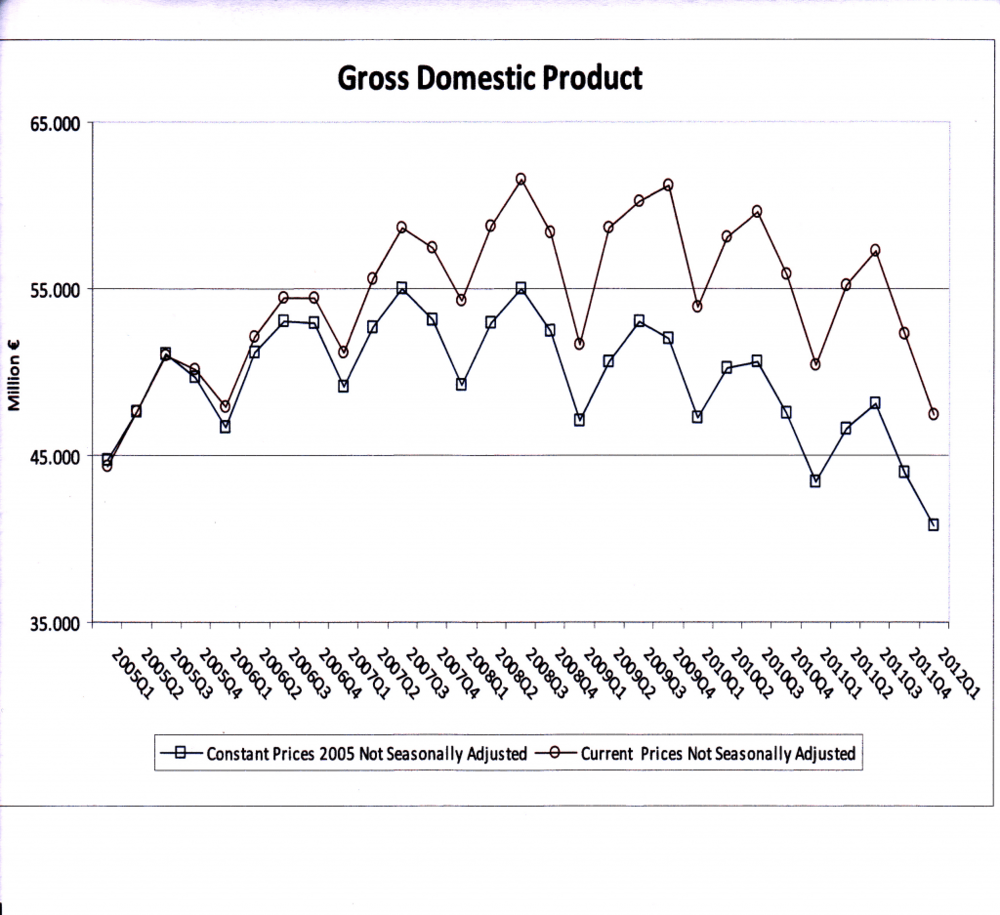
Germany’s GDP grew by 0.5% in the first Quarter (Q1) of 2012, an export-led rebound from Q4 2011, when it declined by 0.2%.  Greece, on the other hand, is still on Charon’s ferryboat (price one Greek coin) across the river Styx to the economic Underworld, as the following GDP graph from the Hellenic Statistical Authority shows… yes, graphically.

greece GDP Q1 2012

The Greek Q1 figure is the lowest for many years, at €40761 (2005 constant prices).  It is 6.19% lower than Q1 the year before, and stands 17.13% below the peak Q1 figure of 2008 (€49188).  That is, Greek economic activity has declined by over one-sixth in 4 years.

On GDP, the Eurostat figures show that one country (Portugal) has had quarter-on-quarter declines for the last 4 quarters.   Four countries now show Q-on-Q declines for the last 3 quarters (Czech Republic, Italy, Cyprus, Netherlands), whilst the UK has its two-quarter double-dip.  Slovenia and Ireland will probably join the “negative 3 quarter club” once their Q1 figures are in.  Italy’s sequence of -0.2, -0.7, -0.8 is especially worrying. And Greece is only excluded by virtue of its extreme cyclicality and lack of seasonal adjustment.  But the divergences are acute.  From Q4 2011 to Q1 2012, Finland shows growth of 1.3%, Slovakia and Lithuania 0.8%, and Germany 0.5%.  At the ‘top’ of the negative end are the Czech Republic (-1.0%) and Italy (-0.8%).

Compared with Q1 2011, six countries showed an increase of over 1.0%, whilst eight countries recorded a lower level of GDP, with Greece (-6.2%), Italy (-1.3%), Spain (-0.4%) and Portugal (-2.2%) being joined by the Czech Republic (-1.0%), Cyprus (-1.4%), Hungary (-1.5%) and the Netherlands (-1.3%).

Trade winds of change

But in a strange way, Greece and Germany are currently, by intention or default, following a similar trade strategy which involves a strong turn away from the single market and their European partners.

Germany we know is a big exporter, and it is still powering ahead, thanks in part to the lower Euro value.  Most of its exports are still to Europe – in 2011, 39.7% to the Eurozone, 19.5% to the rest of the EU, and 11.7% to other non-EU parts of Europe. But this is rapidly changing.  The following graph, from the German Federal Statistics Office, shows the changes in German export and import shares between 2010 and 2011.  There is a slight increase to France and Poland, but the increases – from modest bases – to China and Russia are striking.   Meanwhile, Germany is exporting less (as a %) to the troubled economies of Greece, Portugal, Italy and Spain, plus Belgium.

german import export changes 2010 11

Now, let us look at Greece.  Here too, March 2012 trade figures show an increase in non-oil product exports compared to QMarch 2011 – but also mainly outside the EU.  The EU increase is a decent 8.3%, but the increase to non-EU countries is a startling 34.4%.  Imports also show the same de-Europeanisation  process – down 15.0% from the EU, up 11.7% from elsewhere:

greek trade march 12

In March 2012 compared to March 2011, the share of non-EU exports were up from 29% to 33% of the total, and non-EU imports – which rose while EU imports fell significantly –  went up as a share from 31% to 38%.  If maintained, this represents a major shift in trading balance over a short period.

Fissures of Men (and Women)

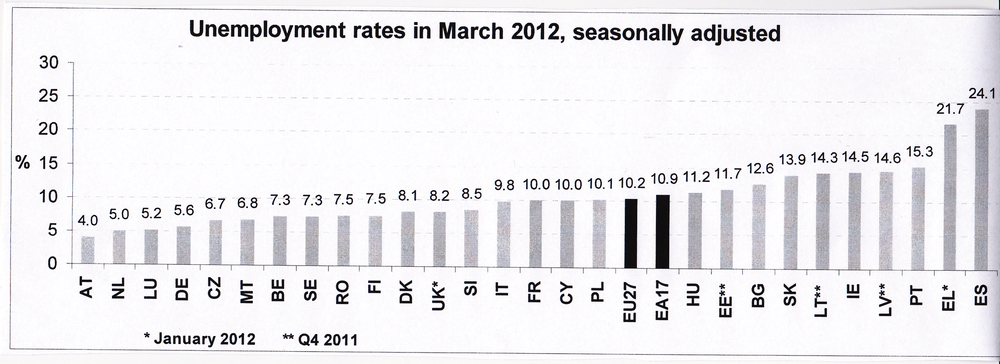
The other growing gap is in employment and the lack thereof, of course.   The EU average of unemployment stands at 10.2%, the Euro area at 10.9%.  Here is the chart from Eurostat:

EU unemp march 2012 Eurostat graph

Over the year March 2011-2012, Spain’s unemployment rate has risen by 3.3% and Greece’s by at least 6%, Portugal by 2.9% and Italy 1.7%.  Austria’s has rduced meanwhile from 4.2% to 4%, and Germany’s from 6.2% to 5.6%.  The figures for young people are terrible, with an average of over 22% for the EU.   Germany’s figure is 7.9%, Austria’s 8.6%, both down over the year ; on the other hand 6 countries have unemployment of over 30%, (with Spain over 50%), in each case higher than in March 2011.  The unemployment rate for women is slightly higher than for men, but both have risen by around 1% over the year from March 2011.  The overall gender difference is far less than the difference between different countries.

Conclusion

The European Union’s, and especially the Eurozone’s, economies are showing increasing signs not only of divergence in economic performance measured by GDP, stark as those are, but also of structural divergence in  the ‘single market’ in labour and in trading patterns, as evidenced by Germany’s and (it appears) Greece’s  shift to non-EU export markets.  Similar process of de-integration are also visible in the banking sector.  The economic problems of the EU, and the crisis in the Eurozone, are having an increasingly negative impact on the process of EU and Eurozone integration, which will increase if overarching policies of austerity continue to be imposed.

Leave a Reply

Your email address will not be published. Required fields are marked *

This website collects cookies and analytic data. To use our website you must consent.
For more information read our Privacy Policy.