Painting: Eugene Delacroix (1840) – 4th Crusaders entering and brutally sacking Constantinople in 1204. Image via Wikimedia. Photo added 23.00h 12 November
As the Autumn Statement looms, it seems that, even within his own Party, there are many who are unhappy with George Osborne’s proposed drastic cuts to the incomes of many of the UK’s lowest-paid, via far lower working tax credits.
There is also growing concern (apparently including the Prime Minister wearing his constituency MP hat!) about the impact of the next big tranche of major reductions in departmental spending programmes for the unfortunate “unprotected” ministries, which include the Home Office, Justice, Communities and Local Government, Transport, Environment…
They are due to take reductions of around 30% of their current budgets over the course of this Parliament, in the Great Cause of achieving an overall budget surplus (i.e. including investment spending) by the end of 2019/20 so that our overall debt level can be reduced by some £10 billion, or 0.0006% of the total stock. (At interest of say 3% p.a. the annual saving on £10bn repaid now would be around £330 million. On this basis, it would take 30-odd years to get any payback from this repayment). For more details of the likely impact of the government’s proposed spending cuts on government departments, see this Institute for Fiscal Studies Briefing Note, October 2015).
But more and more people are questioning the logic and sense of the Chancellor’s strategy, which is increasingly being seen as a political attempt to achieve a permanent reduction in the size and role of the state, rather than as necessary on economic grounds.
In PRIME, we believe that the best, and most successful, economic and fiscal policy is based on securing full, decently-paid employment, which
a) uses up the slack posed by underemployment and
b) maximises (within the current capacity of the economy) economic activity, and
c) in consequence, maximises government receipts from taxation at given rates.
Taxation, of course, should be mainly progressive in character and effect. Investment for the future (especially on tomorrow’s infrastructure and Research and Development) should always be prioritised, and should certainly rise significantly from present levels.
But economics and politics are closely – inextricably – intertwined, and we need to start from the fact that Mr Osborne and the Conservatives (not forgetting the Liberal Democrats in the Coalition government, and not without some help from some within the Labour Party) have demonised deficits and debt to such an extent that any borrowing, however sensible and useful its purpose, is stigmatized as “bad” and damaging to our country’s “security”. (Save, curiously, if it occurs under the benevolent tutelage of the present Chancellor!) This debt demonisation is of course total nonsense, for reasons we have often set out.
At present there are therefore two imperatives. First, to the process of de-demonising debt and deficits (provided of course that debt is incurred for productive or other solid reasons). Second, to develop a new economic “narrative” – a set of metaphors based on sound economic theory – for the nation to live by (to paraphrase George Lakoff and Mark Johnson).
At the same time, the immediate task – on economic and political grounds – is to prevent, if we are able, the destruction of key public services, the undermining of the nation’s security, and the living standards of the vulnerable and those on low incomes. The government cannot cut spending programmes by 20 to 30% – i.e. by some 50% since 2010 – without huge reductions in front-line services such as tax collection, care of the elderly, police officers, street lighting, access to justice, border control staff and much, much more.
A substitute budget framework
We have therefore taken the government’s current spending plans as “vetted” by the Office for Budget Responsibility (OBR), and changed the spending profile in order to show that – even within the current economic logic of all save the “surplus zealots” – the Treasury could simply achieve a balanced current budget before the end of this Parliament, and avoid all of the major real-terms cuts proposed for the next 4 years.
Such a budget framework does not, I emphasize, meet what we consider to be the best economic or fiscal approach for our country at this time – it aims rather to show to what extent the Chancellor’s programme is a political project devoid of economic merit or fiscal necessity.
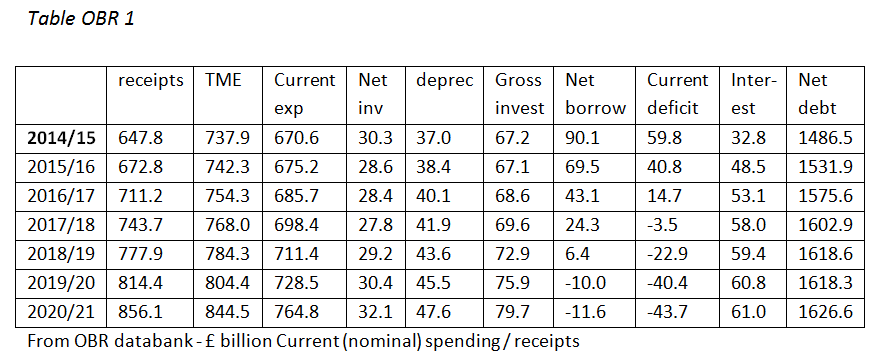
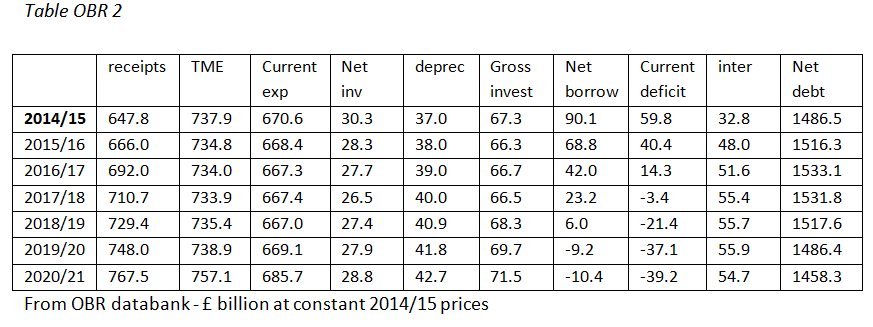
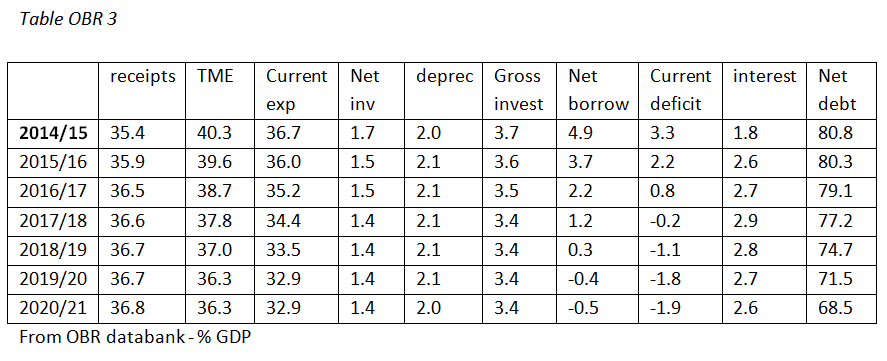
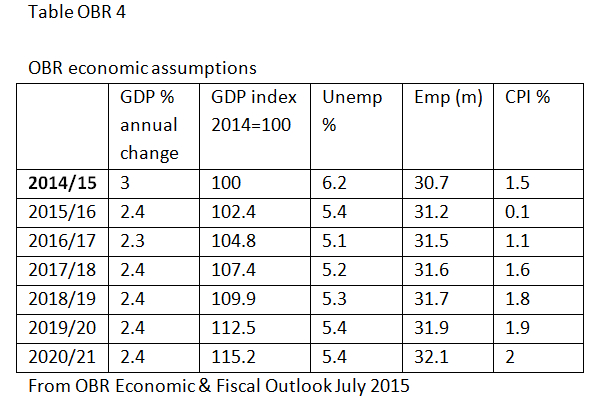
Given that the borrowing over the term of the Parliament, under this alternative framework, is considerably less as a percentage of GDP than the OBR’s assumed rate of increase of GDP, in principle the debt to GDP ratio will fall more or less in line. There are other financing issues which make the precise level of debt more complex (see the OBR Tables in the Appendix to this article for predicted debt under the current government plans). We are however confident that, on the basis set out in our exemplification below, the debt to GDP ratio will have fallen by a significant margin by the end of the Parliament.
In sum, our proposal demonstrates that there is no economic need to undertake the programme of savage spending reductions currently proposed by the government, and that a current budget balance is achievable well before the end of the Parliament without those cuts. Debt will be falling as a percentage of GDP.
Without further cuts, it is also likely (but we have not assumed this for present purposes) that GDP will rise slightly faster than the OBR have assumed, due to the multiplier effect; this would further hasten the fall in the debt to GDP ratio.
Key points of an alternative budget framework:
- Saves government programmes from major real terms cuts over the Parliament, as well as avoiding the proposed new cuts in social security spending
- Increases gross investment by almost 20% over the Parliament
- Maintains current and overall spending, and the level of receipts, at historically normal percentages of GDP
- New borrowing by 2019/20 is for long-term investment, and well below the rate of increase of GDP
- Eliminates the current budget deficit by 2018/19
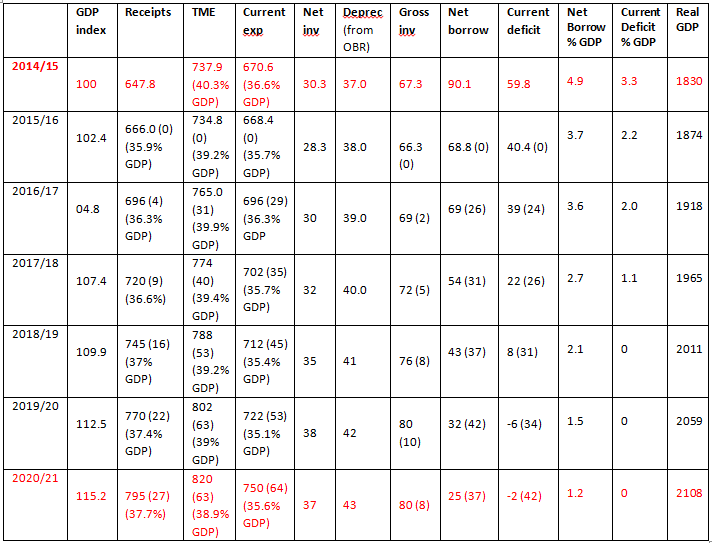
I set out in Table 1 the income and expenditure profile that, we propose, could be substituted for the Chancellor’s. It is based on the OBR economic assumptions as to annual changes in GDP etc. and uses real terms data (i.e. after correcting for the effect of inflation). It is to some extent artificial e.g. since the “multiplier” effect (whether by spending more than planned, or raising more from taxation than foreseen) would in reality tend to alter GDP (upwards, on balance) from the OBR’s assumption.
The main statistical points to note, under the substituted framework are:
- The current financial year 2015/16 is left unchanged since it is too late to affect the position materially
- The current budget deficit would disappear by 2018/19, i.e. for the last 2 years of the Parliament
- There would still be borrowing for investment purposes of £32 billion in 2019/20, representing around 1.5% of GDP. This compares with the present government policy of having an overall budget surplus of 0.4%, meaning that all investment for the long-term future would be funded by today’s taxpayer.
- Gross investment rises from £66 billion (3.4% of GDP) in 2015/16 to £80 billion, or 4% of GDP, in the last year of the Parliament; this is £10 billion more than the government plans to invest in 2019/20
- Total Managed Expenditure (TME), which covers current and investment spending, remains broadly at the same level of GDP throughout (between 39 and 40%) and in the last year of the Parliament would be £63 billion, or about 3% of GDP, higher than present government proposals, but around the same as the Major/Blair/Brown governments.
- Current expenditure (excluding depreciation), which includes both “welfare” and departmental spending, remains in the region of 35 to 36% of GDP, rather than falling as per government policy to less than 33% of GDP. Current spending would be around £45 billion, or 2.25% of GDP, higher in the last year of the Parliament than under the present government’s policy.
- Receipts are increased above the current government plans, from 35.9% in 2015/16 to 37.4% of GDP in the last year of the Parliament, about £22 billion (or just over 1% of GDP) higher in 2019/20 than the government plans.
TABLE 1:
All figures in £bn except where stated otherwise. Years in red are not within the current Parliament. Numbers in brackets show the change in £bn between this substituted “budget” and the government’s. The % of GDP is also given where applicable.