

By Jeremy Smith
The Office for National Statistics today published the latest figures for the UK’s industrial production, including manufacturing. Here is our chart showing the evolution of the index for manufacturing over the last 20 years or so since 1992. As you see, it is not in permanent secular decline, as we are sometimes led to believe. It rose sharply after 1992, and remained relatively high till 2009. In 2012 and now – with very bad January figures – in early 2013, it has slipped back to a low level last seen in 1993.
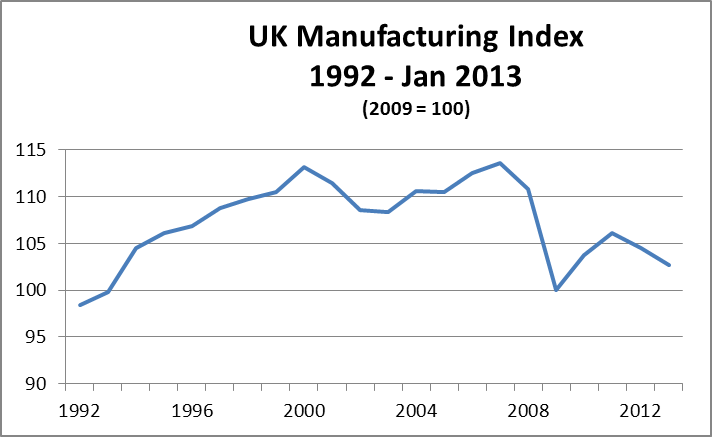
manuf over 20 yrs
The next chart shows the evolution of industrial production (which in also covers mining, quarrying, oil and gas extraction, energy production etc.) over the same period.
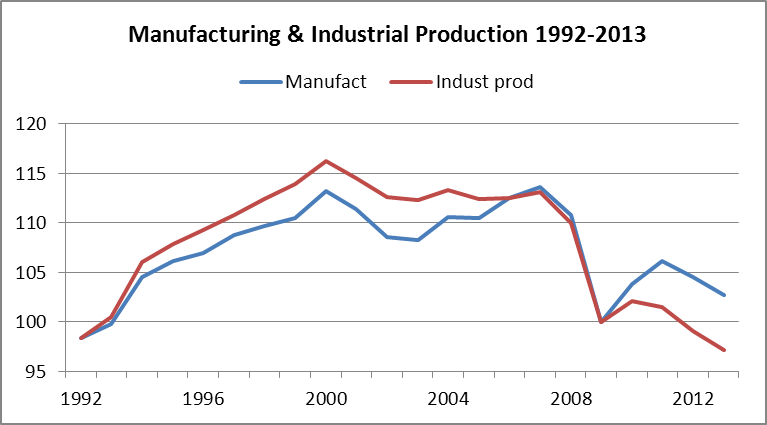
manuf and indust prod 1992-2013


