Back on 19th March, we pointed out (“The Great Leap Forward of the self-employed”) that
Something odd happened in the UK labour market in recent months. The total workforce grew over the last year by 459,000, and over the last quarter by 105,000. But over the last year, the number of employees has risen by 198,000, while the number of self-employed has leapt by 285,000 – a huge 6.8%.
We also said that most of this huge increase in the self-employed (211,000) had come in the last Quarter to Nov-Jan 2014. Both genders have increased substantially, but the % growth in women self-employed is slightly higher, though not in absolute terms. We thought it worth looking a little deeper into the numbers.
ONS provides several datasets which give information on the self-employed, but most of the more recent detail is for the period to October-December 2013, whereas the headline figures above cover the period to November-January 2014. Thus they are not directly comparable. Nonetheless, the trends seem clear.
Changes by industry
Dataset EMP14 gives all self-employed by industry sector, and shows a year on year increase in total numbers of self-employed to Oct/Dec 2013 as 161,000. The main elements of this increase are as follows:
Construction: +50,000. Of these, 44,000 were males.
Wholesale, retail & repair of motor vehicles: +29,000. Of these, 27,000 were females.
Professional, scientific & technical: +14,000. The increase in males was 25,000, but the number of females fell by 11,000
Other services: +28,000, of which 23,000 were females.
Changes by occupation
Dataset EMP09 provides information for the same period broken down by occupation. This seems to dovetail tightly with the above numbers per industry. Again, we just refer here to the larger year on year changes:
Managers and senior officials: +33,000, of which +23,000 males, +10,000 females
Personal services: +38,000, of which +33,000 females.
Process, plant & machine operatives: + 38,000, of which 34,000 males
Elementary occupations: +20,000, of which 14,000 women
In terms of ethnicity, for the year to Oct/Dec 2013, of the total annual increase in self-employed of 161,000, the White self-employed was 102,000 (or just 2.7%), split almost exactly 50:50 between men and women.
The absolute increases within other ethnic groups were by definition not so great, but in % terms we see that Pakistani self-employed rose by 18% (15,000, effectively all men), Black African Caribbean by 23% (14,000, of which 10,000 men) and Other by 14% (15,000).
Not all down to the over 65s
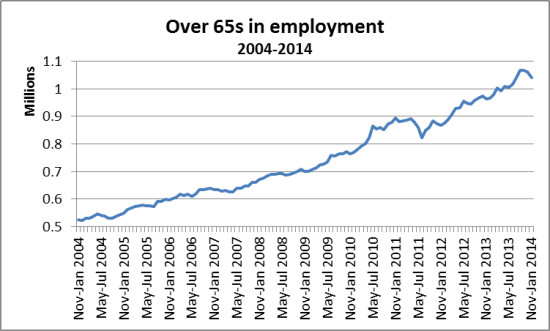
We have also looked at the overall number of those in employment (of whatever form, as employees or self-employed) aged 65 and over. This is a “demographic” that has been increasing quite substantially over the last 10 years in particular – but it seems that in the last few months, the number of this age group in some form of employment has actually declined a little. So it seems unlikely – though the self-employed are not disaggregated – that the very recent significant increase in the number of self-employed is due to changes in this age group (i.e. the baby boomers as they hit potential retirement age).
Nonetheless, the increase in the numbers of those 65+ in the workforce is extremely important over the last 10 years. The overall number of those in employment, from Nov/Jan 2004 to Nov/Jan 2014, has risen by over 1.8 million, while the number of those aged 65+ in employment has almost doubled (from 526,000 to 1.04 million) and thus risen by 514,000. This means that an extraordinary 28% of the increase in employment over the last decade is due to the over 65s!
Taking the period of the current government’s term of office, we note an overall increase in those employed (since March/May 2010) of 1.26 million, while the number of over 65s has gone up by 240,000. This means that the over 65s form 19% of the total increase in those in employment of some kind under the Coalition government.
Conclusion
We may conclude that thee are three significant elements to the last year’s increase in numbers of self-employed.
There is a major increase at the “upper end” in managers and senior officials (and also in professional occupations) – this is mainly but not only a male phenomenon.
The construction industry has woken up again, and the number of self-employed in the industry has risen significantly – and we assume that the “process, plant and machine operatives” are mainly in construction. This is also mainly a male thing.
The big increase in “personal services” is almost entirely down to women, up by 33,000 or 15% in a year; women are also over-represented in the increase in “elementary occupations”.
over 65s inemployment


One Response
The ONS published in the Economic Review: “”Workers aged 50 and above account for more than 70% of the increase in self-employment since Q1 2008.”