In opening the traditional Institute for Fiscal Studies debrief on the budget, its director Paul Johnson remarked that “there has been a change in economic philosophy within three months. Which is remarkable”. That’s because Chancellor George Osborne had announced that in 2019/20, instead of creating a huge budget surplus that year of £23 billion in that year, this had been reduced to £7 billion.
And this surplus is to be created in the last year of the next Parliament, to follow “the cuts of more than 5% implied in each of 2016-17 and 2017-18 [which] are twice the size of any year’s cuts over this Parliament.” So it’s not just a case of the Rollercoaster approach to fiscal policy, as the Office for Budget Responsibility (OBR) dubbed it. Many of our public services are to be flattened and crushed first. The SteamRollerCoaster budget.
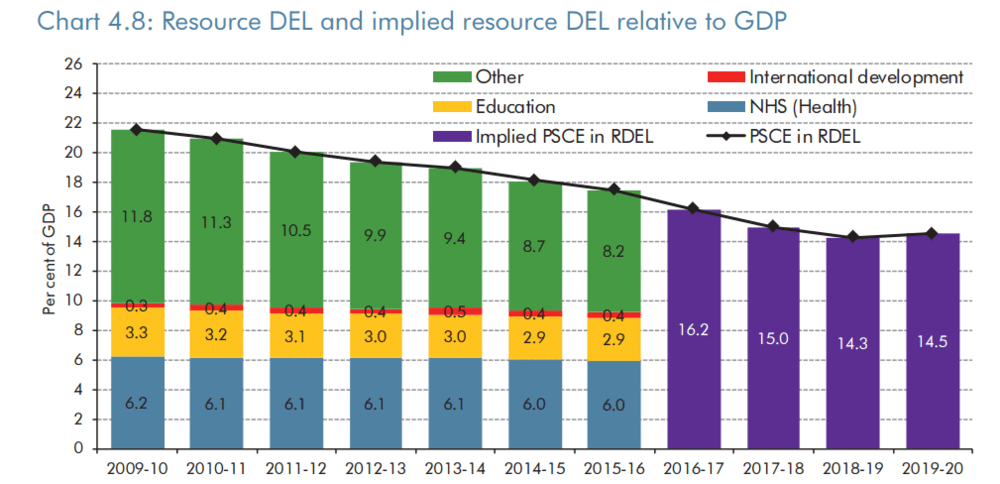
The OBR’s Economic and Fiscal Outlook has one chart which is well worth paying attention to. It shows Departmental spending limits as a percentage of GDP for the period 2009/10 through to 2019/20. It shows the “protected” areas of the budget – NHS, Education, and international development – and then in green, all other services. Here it is:
Thus in 2009/10 the protected services were 9.8% of GDP, and all other services 11.8% (total 21.6%). Put another way, protected services came to 45% of the budget, and unprotected services to 55%.
Fast forward to 2015/16, and we find that protected services – which have been protected in real terms financially but not in terms of % of GDP – are around 9.3% of GDP, with unprotected services having fallen back to 8.2% of GDP. In the next financial year, starting in April 2015, we see that departmental spending has fallen back to 17.5% of GDP; the three protected services now comprise 53% of the total departmental spending, and all the rest (the unprotected) form just 47%. Or again, unprotected services, as a percentage of GDP, have fallen by 30% over 6 years.
Fast forward now to 2018/19, and what do we find? Departmental spending in toto is to be capped at 16.2% of GDP. Although the sums have not yet been allocated against individual services or departments, the Conservatives have committed to protecting (in real financial terms) NHS, schools and international development. Together the protected services will therefore remain at say 9.2% of GDP, leaving the remaining unprotected services at just 7% of GDP. Protected services now form 57% of all departmental spending, the remaining services just 43%. Unprotected services will have fallen, on this basis, by a stunning 41% since 2009/10, as a proportion of GDP.
Or in money terms, about £43 billion off unprotected services in 2018/19 – a 22% reduction from 2015/16. One fifth gone – not from the start in 2010, but as from now, after all the cuts to date.
And then – in order to provide sweeteners before the following general election – the position is eased by a considerable margin in 2019/20, with a gain of £10 billion, bringing the total cuts over the Parliament to some £30 billion for unprotected services. What a perverse way to plan a nation’s public services! First steamroller, then roller-coaster…
Unprotected services include, let us recall, police, defence, housing, transport, environment, the legal system, border control, grant to local government, culture, diplomatic service…and so on. No wonder many feel that this level of reduction is hugely dangerous to the maintenance of a decent society, even if achievable.
“Ah but..” says the Chancellor, “we will not do it all by cutting departmental budgets. We will get £12 billion by further cuts to welfare benefits, and raise £5 billion by clamping down on taxavoidance.” But the tax collection target is a mere aspiration – we can wish the next government well in this regard, but we have no evidence that they will succeed.
As for the next £12 billion of welfare benefits cuts, the Chancellor has – despite being pressed – declined to specify where these will fall, apart from a reduction in working age benefits, which the IFS estimate at about £2 billion. Paul Johnson, IFS’s today said:
“It is now almost two years since he announced his intention of cutting welfare spending by £12 billion. Since then the main announcement has been the plan not to cut anything from the main pensioner benefits… And remember apparently the “plan” is to have those £12 billion of cuts in place by 2017/18. It is time we knew more about what they might actually involve.”
And as the IFS point out, it is virtually impossible to cut a further £12 billion off the welfare benefits budget without targeting the poorest in society – which would sit ill with the government’s claim that we’re all in it together.