“Faced by failure of credit, they have proposed only the lending of more money” Franklin Delano Roosevelt, inaugural address, 4 March 1933
1. Introduction and overview
Ten years ago the bursting of private debt ‘bubbles’ – most obviously in the US, UK and on the periphery of the EU – woke policymakers to the importance of balance sheet dynamics. Today, commentary by international organisations has ongoing rises in private debt as a key risk to global outcomes.
New and extensive data collection and reporting allows commentators to examine the position more closely, with the latest IMF ‘global debt database’ offering both worldwide coverage and time series extending as far back as 1950 for a good number of these countries.
In the discussion below I summarise key movements by country, emphasising changes in debt ratios over time as well as levels. The technique throughout is graphical rather than econometric, partly for clarity and accessibility, but also the role of psychological factors means any formal techniques might be spurious. Rapid reversals – deleveraging – tend to be more easily identifiable from change measures. A threshold of four percentage points (ppts) of GDP a year is proposed above which balance sheet dynamics might be understood as hyperinflations.
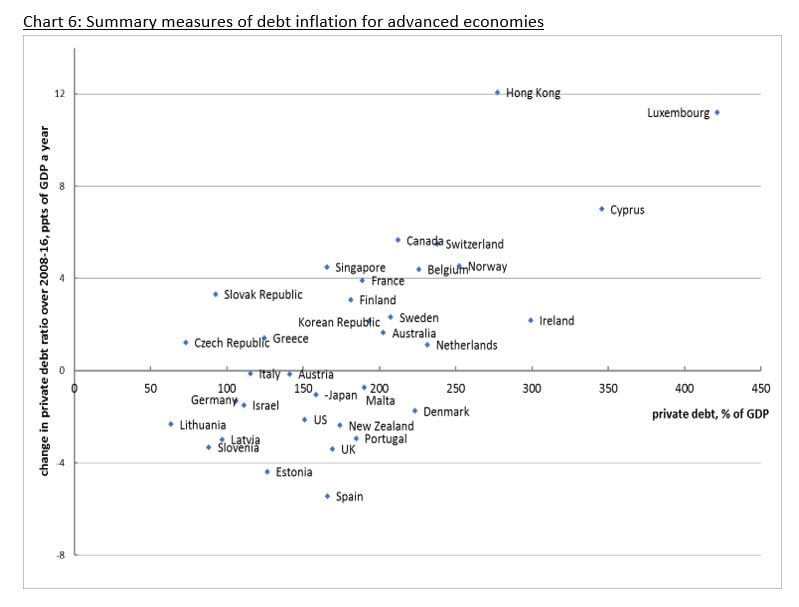
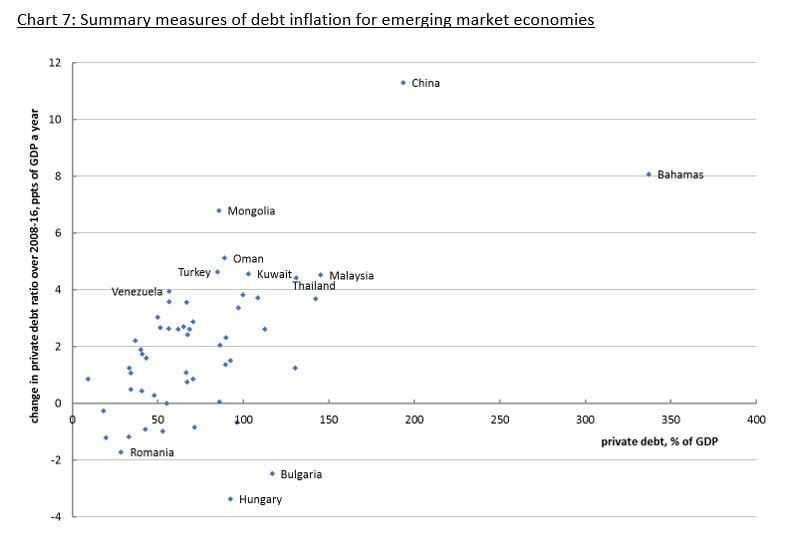
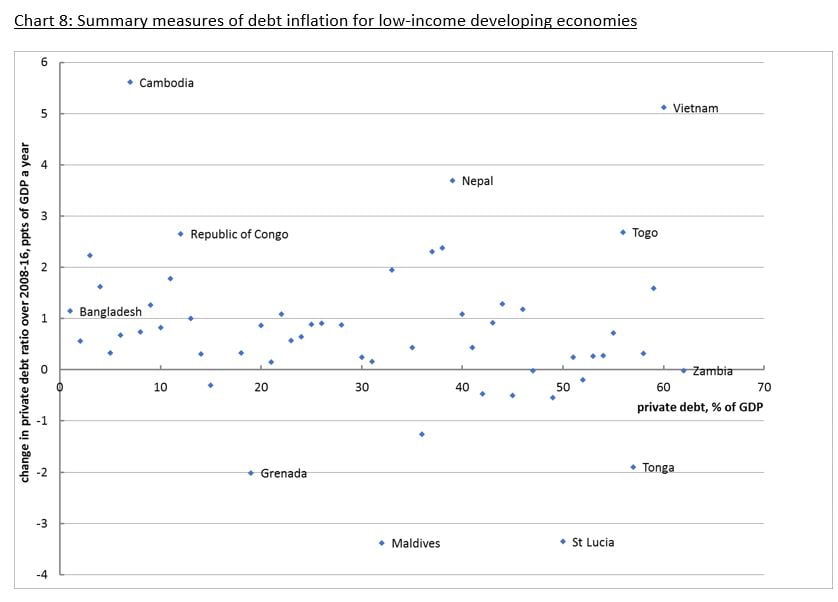
This threshold (taken literally) suggests that at present the following economies are in the most extreme territory:
advanced economies (AE): Hong Kong, Luxembourg, Cyprus, Canada, Switzerland, Norway, Singapore and Belgium
emerging market economies (EME): China, The Bahamas, Mongolia, Oman, Turkey, Kuwait, Malaysia, Thailand, Venezuela, Qatar, Lebanon, Chile, Paraguay and Georgia
low-income developing countries (LIDC) Nepal, Vietnam and Cambodia
More generally – since the financial crisis – still high debt inflation has been the norm for the great majority of countries. Of countries where debt levels are reducing, some are doing so slowly relative to historic experience and therefore still operate at high levels of indebtedness. The UK and US are in this category. Some countries are now under pressure in financial markets, especially EMEs. But there are also tentative signs of falling asset values (e.g. property prices and corporate bonds) in some AEs.
The IMF figures also show that private debt hyperinflation was not a feature of country experience ahead of 1980. Including public debt, debt inflation (let alone debt hyperinflation) was non-existent. Setting these outcomes against those after 1980 arguably vindicates post-war policies aimed at containing global finance. These policies were motivated by Keynes, whose argument is briefly reviewed. His approach facilitated the resolution of the great depression; it may yet offer a way forward today.
2. IMF data and high-level assessment
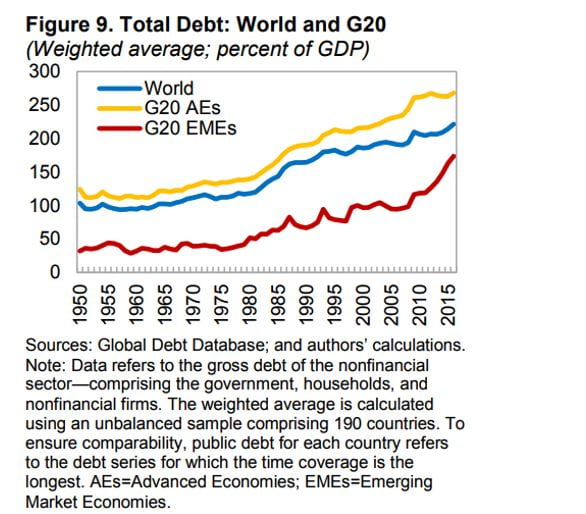
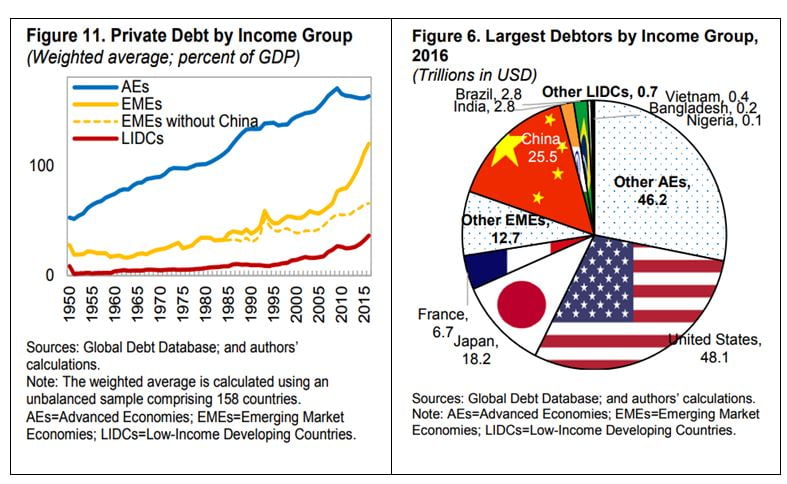
The IMF ‘Global Debt Database’ is the richest source yet for the analysis of indebtedness – putting similar initiatives from the Bank for International Settlements and McKinsey in the shade. So far their associated commentary on the results is very high-level. The story is told in a matter-of-fact way, but here we address the detail that can be lost in the headline narrative. The IMF emphasise that for global total debt “no deleveraging has taken place since the onset of the GFC” (their ‘Figure 9’, copied below) . But their analysis focuses on the differing trends of public and private debt and the experience of emerging and advanced economies as a whole. So that: in spite of deleveraging in advanced economies, global private debt is rising because of emerging economies. Moreover total debt in advanced economies is rising because of increases in public debt.
3. Country level results
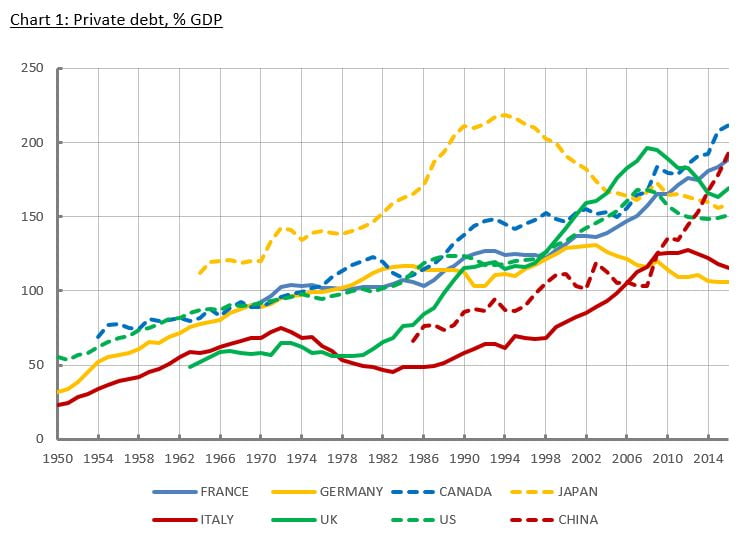
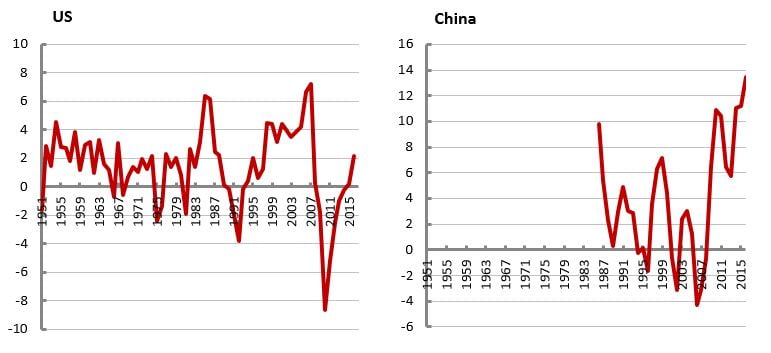
The figures for the G7 and China on Chart 1 show the multi-layered story at country level. (‘Total private debt, loans and debt securities’ is used throughout, as it is reported for most countries with the longest historical runs. I don’t examine household and corporates separately: in general private debt inflation is driven by both, and likewise private debt deflation, but plainly there can still be important differences by country.)
There has been a generalised private debt inflation since the 1950s, but certain episodes stand out. Most obviously, chronologically: Japan, then the UK and US. The Japanese debt inflation came to an end more than two decades ago, but even now the level is still high; likewise the UK and US peaked ten years ago, though deleveraging has progressed relatively less far and note the uptick into 2016. In Canada and France, debt inflation continues uninterrupted, and the former is not far from the Japanese peak.
In China, the pace of debt inflation since 2008 is faster still than Japan in the 1980s. Only in Germany and Italy have trends appeared more benign, though it is possible that there is a different story on public corporation indebtedness (which is not included in the IMF database). More generally it is not known how well the National Accounts capture new forms of lending, not least shadow banking.
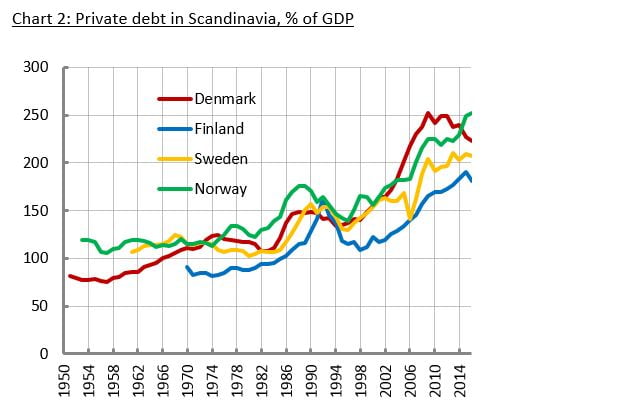
Charts 2-4 show various groupings of countries as illustrative of developments on a broader view. In Chart 2 Scandinavian economies are seen with extremely high debt, with both Norway and Denmark outstripping the Japanese peaks.
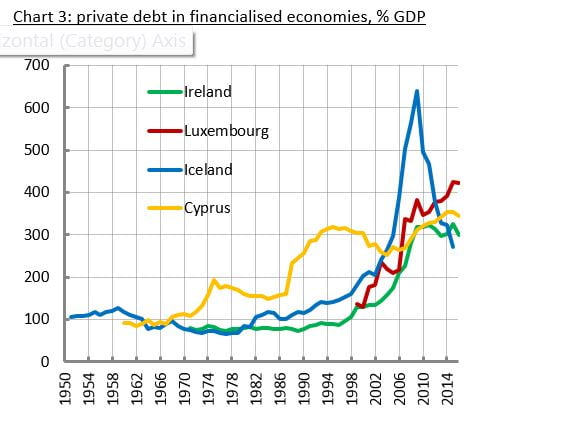
In chart 3 we see the position of some smaller economies that are heavily financialised and still at extreme levels of indebtedness, even Iceland after vast deleveraging.
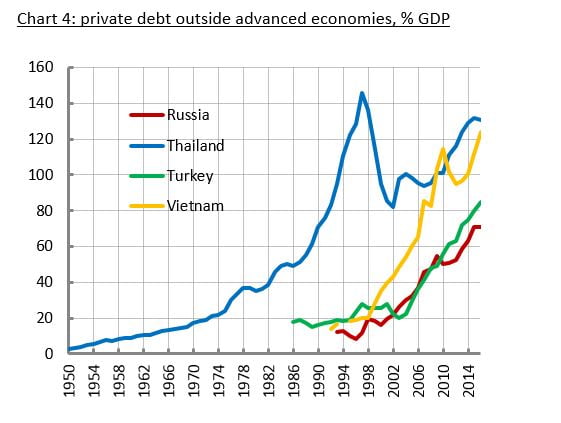
Chart 4 shows some example EMEs and LIDCs in the throes of very rapid debt inflations, including a renewed episode in Thailand following the original SE Asia crisis in the late 1990s.
4. Discussion of empirical results and summary statistics
Those who regard the analysis and monitoring of balance sheet statistics as important, or even essential, sense a critical relation between economic crisis and excessive leverage. The defining characteristic of an excess expansion is an inflation of private debts; and contraction, recession or depression is caused by violent deleveraging. As with the IMF data, leverage is measured as total liabilities (sometimes excluding equity) as a share of income (GDP or disposable income). The simple intuition is that the repayment of corporate or household debt must ultimately depend on income. A high and/or rapidly rising debt to income measure is therefore indicative of unsustainability. Plainly any such process sits uneasily with mainstream ideas of rationality, though a feature of balance sheet dynamics is that assets inflate in parallel with liabilities. Stocks can appear to be in kilter when they are out of kilter against flows.
This thinking leads to the idea that there might be thresholds defining excess private debt. Certainly of the G8 economies the most severe debt crises have been associated with extremely high and then falling levels of debt. But other countries have been beyond these thresholds for some time and have not reversed. Others have had crises at lower levels of debt, e.g. the Scandinavian economies in the late 1980s and Thailand in the late 1990s.
An alternative perspective is therefore the pace of increase of indebtedness. Plainly in the years ahead of the crises discussed above, debt was inflating very fast; but on this basis we could add the UK and Canada in the late 1980s and also Italy in the 2000s.
To distinguish these episodes from gentler debt inflations, I propose the terminology ‘debt hyperinflations’, which captures also a sense of exceptionality and severity.
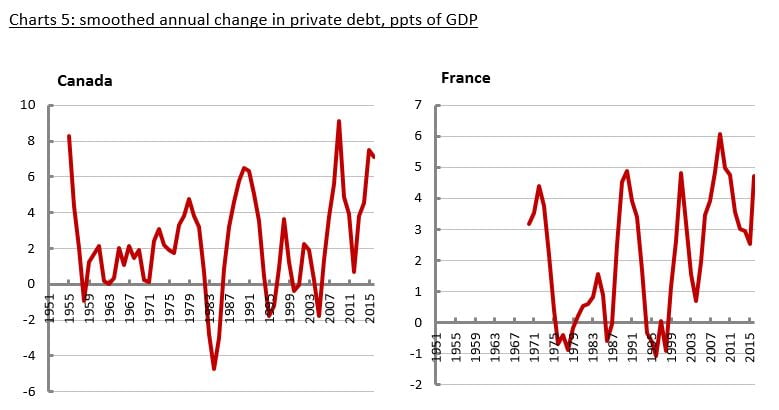
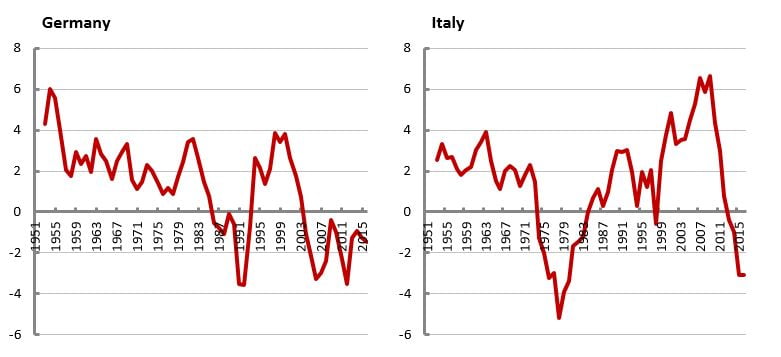
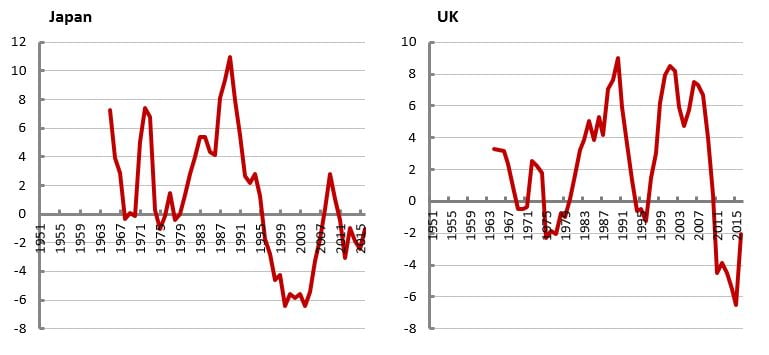
Charts 5 show for the G7 economies and China the annual change in the private debt ratio in percentage points of GDP, with a three-year moving-average applied to smooth some noise from year to year.
By inspection, a sustained difference above 4 percentage points of GDP a year appears the best indicator of a coming sustained reversal, i.e. differences below zero for more than one year. The UK and US are particularly clean examples of the threshold in action, but it is broadly true of all relevant episodes across all countries. Only Germany seems to operate with slightly lower differences. The figures affirm the extreme vigour of the present expansion in China, not least in comparison to Japan in the 1990s. There are also vigorous debt inflations – hyperinflations – in Canada and France.
Chart 6 provides a summary measure of the present position across all advanced countries, setting the level of the debt ratio in 2016 with the change-over 2008-2016 (measured in percentage points of GDP a year). Using the threshold derived from the G7 experience, the countries in debt hyperinflation are those where the change is above 4 per cent. Notably the advanced economies split almost half and half between those where debt is inflating and those where debt is deflating relative to 2008.
The same can be done for EMEs and LIDCs – Charts 7 and 8. The data points are not all labelled, but full results are shown in the annex. Debt is inflating in around 80 per cent both of EMEs (average 2.8 ppts of GDP a year) and LIDCs (averaging 1.3 ppts of GDP a year). For the former there is a strong relation between differences and levels; this is less so for the latter.
Debt inflations continue in around half of advanced economies and the great majority of other economies.
5. Discussion
A majority of the world economy is therefore underpinned by worrying and rising levels of debt. It is perhaps unsurprising that the international organisations regard private indebtedness as a key risk to the economic outlook:
Debt burdens are still high, and often growing, relative to output and incomes. The economies hit by a balance sheet recession are still struggling to return to healthy expansion. In several others, financial imbalances show signs of building up, in the form of strong credit and asset price increases, despite the absence of inflationary pressures. (BIS, 2015, p. 7)
Still-elevated risk-taking and high debt levels in many countries raise financial vulnerabilities. (OECD, 2018a)
Other after effects of the crisis seem more durable, however, including higher debt levels worldwide and widespread public skepticism about policymakers’ capacity and willingness to generate robust and inclusive growth. (IMF, 2018, p. xiv)
However, rising nonfinancial debt as a share of GDP and the accumulation of vulnerabilities weigh on the medium-term outlook. (IMF, 2018, Box 1.8. ‘Growth Outlook—Emerging Market and Developing Economies’)
The BIS apart, this is in stark contrast to last time around when warnings came only from outside the mainstream of the profession. Steve Keen and Ann Pettifor followed in the footsteps of Wynne Godley, Charles Kindelberger and Hyman Minsky who had kept alight the flame that had been lit last time around by Irving Fisher (1933). (Fisher was however a more mainstream character: he came to debt after the event, having previously – and infamously – proclaimed the US stock exchange expansion would endure.) Various questions still arise.
The obvious question is what triggers the deleveraging process? Given that debt hyperinflations are inherently unsustainable, reversal must be inevitable. The particular mechanisms might vary, but the constant factor must be psychological: a reversal of excessive ‘animal spirits’ and dawning of reality.
At present an ongoing tightening of monetary policy is strengthening the dollar and putting pressure on emerging market debt denominated in dollars. Conversely the dollar may be strengthening in part because markets are recognising the unsustainability of the position in EME. For example Bhanu Baweja of UBS rebukes EMEs for disappointing on growth (FT, 22 May 2018, ‘Pain over rising dollar belies the real challenge for emerging markets’), though doubtless other City commentators helped to foster excessive expectations in the first place. In parallel associated falls in prices of financial instruments will lead to abrupt rises in the rate of interest. To the extent that corporations and households must borrow to stay afloat, these pressures may lead to bankruptcies and redundancies in the real economy. In advanced economies there may now be pressure from weakening asset prices, for example tentative signs of falling house prices in Canada and lower prices for US corporate bonds.
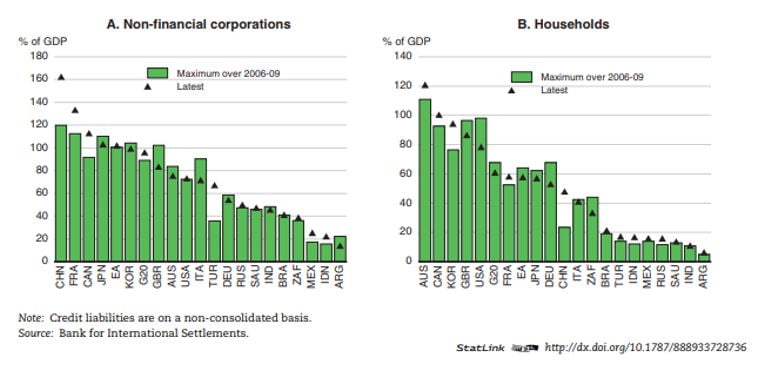
In their latest assessment of the macroeconomic situation, the OECD (2018b, Figure 1.19) show “private sector credit liabilities remain high in many large economies” as follows:
Here the sectoral presentation shows China, France and Canada standing out on the corporate side; on household liabilities, France and China are less bad, with Australia and Korea instead in front, and Canadian – also UK and US – household liabilities still extremely elevated.
They identify potential corrections in asset prices “given still-high valuations in some markets (including equity markets in the United States; housing markets in Australia, Canada, New Zealand, Norway and Sweden; and corporate bonds)” (ibid., p. 29) and also note “bond issuance by the private sector has been high and the quality of covenants that protect the interest of holders of non-investment-grade bonds, including in the United States, has declined” (ibid., p. 29).
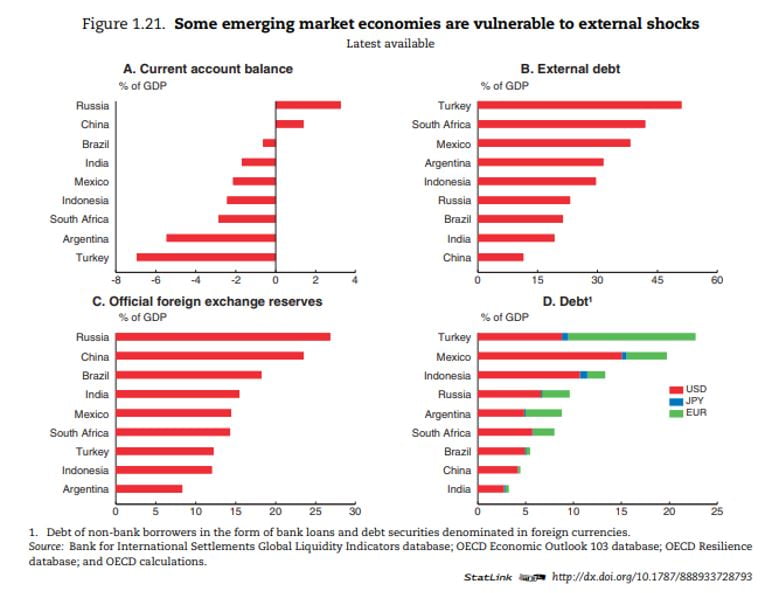
EMEs are dealt with separately, with assessments of the level of external debt as a whole, and external debts denominated in foreign currency.
As above, they warn, “vulnerabilities also arise from a possible abrupt deterioration of investor confidence, resulting in the weakening of domestic currencies and asset prices” (ibid., p. 31). They draw attention to recent stress in Argentina and Turkey and observe: “but a widespread market correction in EMEs similar to the taper tantrum in 2013 or at the beginning of 2016 has been avoided so far” (ibid., p. 31). On balance “many” EMEs are seen as “less vulnerable” but “a few … remain[ing] more exposed to sudden changes in market sentiment”. The latter is based on an assessment of government budgets and current account deficits, foreign currency reserves and foreign-currency denominated debt.
Given this perspective lets China off the hook, the OECD then turn to internal vulnerabilities: “Financial stability concerns also persist in China and some other East Asian economies, as rapid property price growth has coincided with a pick-up in property developers’ borrowing” (they examine associated financial engineering and heavy refining needs over 2019 and 2020). In retrospect, the answer to the question of whether vulnerabilities arise from internal or external liabilities? is plainly – ‘both’ (not least given the prior experiences of Japan, the US and UK). Given the overall scale of private debt inflation across EMEs (and LIDCs), the OECD may here be underestimating vulnerabilities.
The question after the Japanese, US and UK crises is how far can policymaker action hold back the deleveraging process? Massive subsidies and favourable loans to the financial sector in part underpinned by the creation of new central bank reserves on a unprecedented scale and large-scale government borrowing, did not prevent but put a floor under the deleveraging process. All three countries remain relatively highly indebted. The OECD and IMF emphasise in particular ongoing corporate debt inflation in the US.
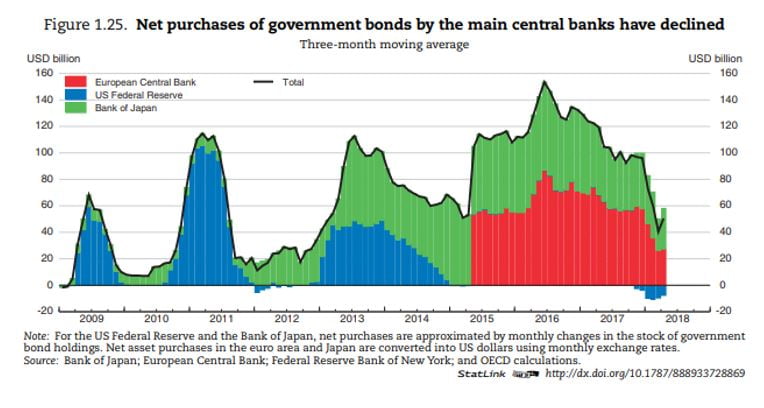
Plainly there are concerns that such vast levels of support may have become indispensable, and notably every effort to withdraw monetary support has ended in failure and reversal. The quantitative easing record shows central banks effectively taking turns to provide support to financial markets. The OECD (2018b, Figure 1.25, below) illustrate this process and more generally the mind-boggling scale of this support (though note the figures are confined to government bonds, when central banks have also been purchasing corporate debt).
As the world economy falters, we might be sceptical that the coming withdrawal – quantitative tightening – will proceed as planned.
But, even given the system might be supported indefinitely, plainly this is very far from a viable and efficient model. In parallel, in spite of these fundamental fragilities, policymakers have insisted on austerity policies that have precluded the possibility of any genuine revival in economic activity and have made public debt worse not better.
6. An alternative way forward
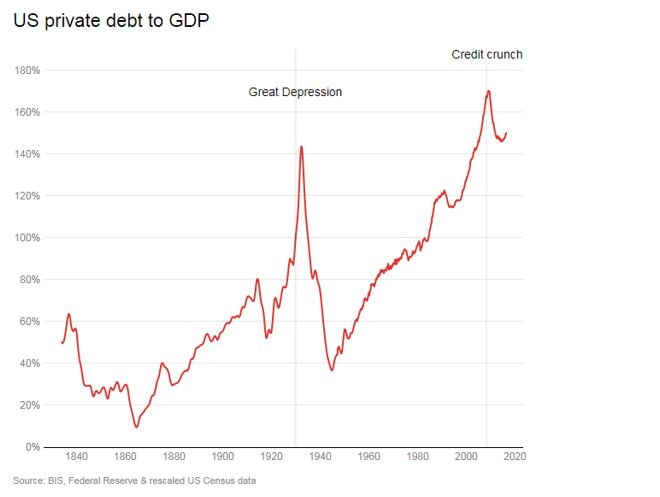
One of today’s complacencies is that policymakers learned the lessons of the great depression. But while action has so far prevented collapse on the scale of the 1930s, no forward momentum has been achieved. Keen (2018) shows a consistent time series for US private debt back to the middle of the nineteenth century; this indicates deleveraging proceeding rapidly from a peak in 1933 through to 1945.
Contrary to conventional wisdoms, from the New Deal onwards, US policymakers implemented strongly expansionary monetary and fiscal policies. (The same was true in the UK.) The extreme extent of the debt inflation and the abruptness of the deflation is also related to movements in GDP on the denominator. US GDP peaked in 1929; it had fallen by 45 per cent when the debt ratio peaks in 1933 (in nominal terms); it then rises by 300 per cent to the end of the war and the trough in indebtedness. This is in sharp contrast to today when (policy inflicted) post-crisis stagnation has meant stunted contributions to deleveraging from economic growth.
Monetary action also operated on an institutional level, with public authority imposed on a system that had been dominated by private financial interests. Most obviously the gold standard was terminated, and a great deal of control was exerted over the Federal Reserve and the banking system. In general, policy was aimed at supporting domestic expansion.
The policy shift in fact had begun on the other side of the Atlantic, when on 21 September 1931 the UK were the first to come off gold. By the mid-1930s nearly the whole of the world had followed suit. Similarly the later Bretton Woods arrangements underpinned a (still far from ideal) new global order where finance was contained and aimed at domestic needs.
All these initiatives were greatly influenced by Keynes’s analysis, and in particular his emphasis on monetary policy and international financial arrangements.
In Tily (2006) I sought to restore these conclusions, and also to establish a critical relation between the cyclical process that he described in Chapter 22 and balance sheet dynamics. Society has lost Keynes’s view of the paramount importance of setting a low long-term rate of interest – i.e. cheap money – and his warnings that we should avoid dear money “as we should hell fire”. Dear money not only contains investment and therefore overall economic activity, but is also the cause of violent instability. Keynes saw the US great depression in these terms as early as 1931:
We are today in the middle of the greatest economic catastrophe – the greatest catastrophe due almost entirely to economic causes – of the modern world … I see no reason to be in the slightest degree doubtful about the initiating causes of the slump … The leading characteristic was an extraordinary willingness to borrow money for the purposes of new real investment at very high rates of interest – rates of interest which were extravagantly high on pre-war standards, rates of interest which have never in the history of the world been earned, I should say, over a period of years over the average of enterprise as a whole. This was a phenomenon which was apparent not, indeed, over the whole world but over a very large part of it. (Keynes, 1931, pp. 343-5)
There is a fundamental confusion that the rate of interest is inversely related to the amount of lending by the financial sector: dear money is presumed to restrain lending and vice-versa. The problem inherent to Keynes’s account of the cycle is that it doesn’t. Dear money instead reduces the probability of repayment: as it is far easier to earn a low rather than a high rate of interest.
Federal Reserve statistics showed the long-term rate of interest on US corporate debt brought under control during the depression, with relatively cheap money prevailing through to the 1970s. But from the 1980s, interest reverted to the levels of the 1920s. (In the aftermath of the global financial crisis central banks and other policymakers have been promoting real theories of interest and empirical arguments around a secular reduction in rates over several decades. I have contested this narrative in Tily (2016).)
On this basis the present instability and the parallels with the 1920s are no surprise.
For my early research the only readily available data on debt were for the UK and US. Both suggested a perilous level of indebtedness, not least when set against Fisher’s (1933) assessment of the US in the Great Depression. But equally there was a sense that debt inflation was more benign ahead of the 1980s, which would also follow from Keynes’s theory.
The IMF aggregate figures for private debt show as they put it “the global leverage cycle … dominated by advanced economies for almost six decades”, with their chart (‘Figure 11’) showing a near stable gradient throughout. But these movements are likely to be dominated by the US, shown separately (‘Figure 6’) as now accounting for an astonishing 40 per cent of advanced economy debt and just under a third of global debt.
The G8 level data (Figure 1) show both Germany and Japan as well as the US with debt inflations ahead of the 1980s, but the position for other countries more benign.
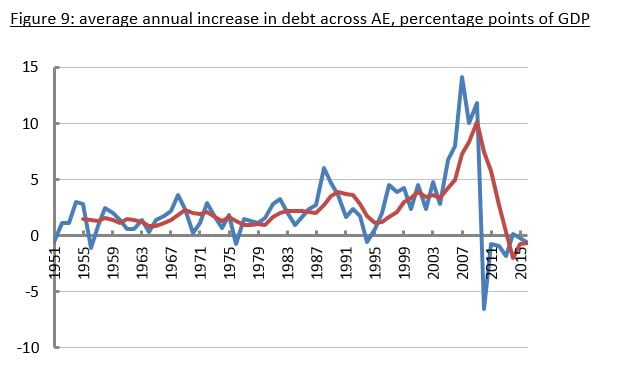
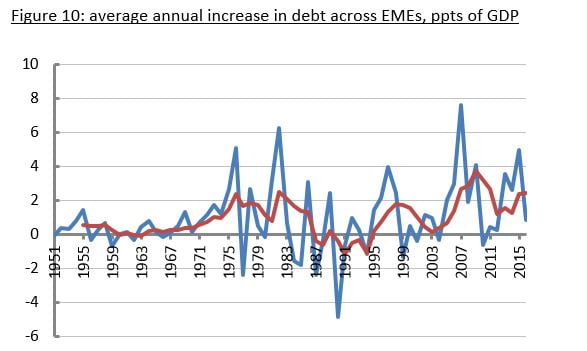
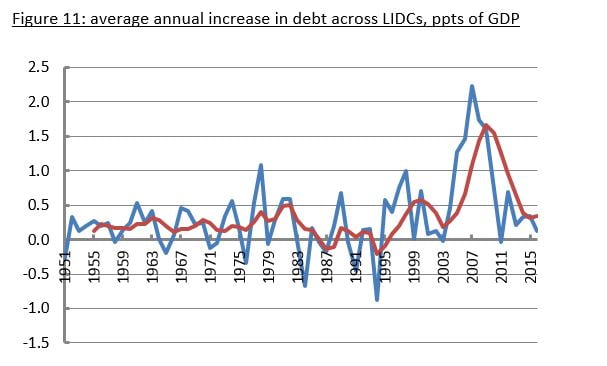
Again differences are the obvious way to assess the scale of debt inflation over time. Charts 9 to 11 show for each of AE, EMEs and LIDCs, the average differences each year for countries where data are available and a 5-year moving average (this means the sample tends to get larger over time).
Looking across the fuller samples shows a generalised more benign position ahead of 1980, beyond these larger economies. In all three groupings there is a relatively decisive upward shift beginning between 1970 and 1980, at which point the differences also exhibit far greater cyclicality.
In the annex results for individual countries are shown: for AE, the greatly reduced growth of leverage ahead of 1979 is re-enforced, with the annual pace of increase around 2.5 times higher over 1979-2008, but then greatly shrinking back after 2008; for EM and LIDC, again very low growth ahead of 1970, but leverage picks up over the 1970s, and notably there has been no reduction in debt inflation before and after 2008.
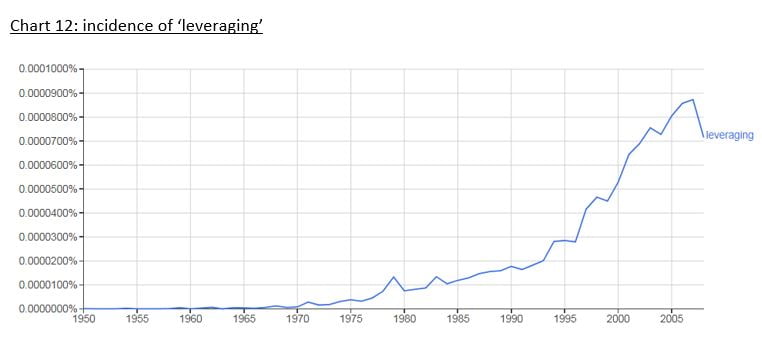
An alternative perspective comes from the ‘google book Ngram viewer’: chart 12 below shows the incidence of the word ‘leveraging’.
The IMF see a distinction in the trends on either side of 1980 for public debt only:
up to the mid-1970s global public debt went steadily down only to reverse its course afterwards. In the first phase, the fall in public debt is mainly explained by advanced economies where growth, inflation, and financial repression pushed debt ratios down.
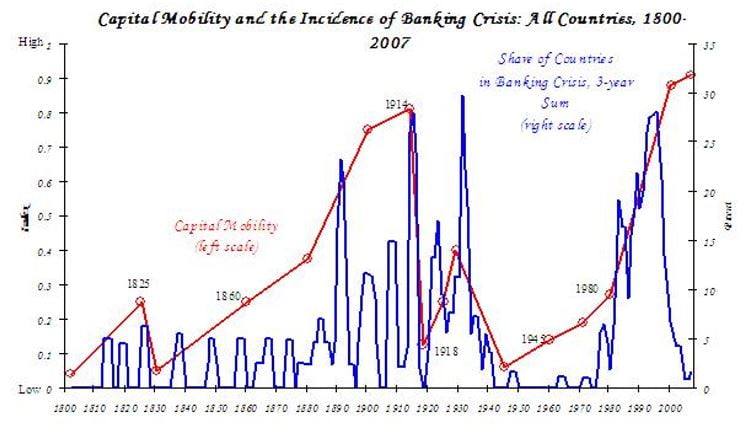
But really for most countries private debt was more benign up to the mid-1970s. And, of course, this climate of ‘financial repression’ was better not only for debt, but also for growth and employment. It was better also for economic stability, with the canonical Reinhart and Rogoff (2009) chart showing a complete absence of financial crises in the Bretton Woods era. Conversely higher private debt has gone hand in hand with higher public debt, greatly deteriorated real outcomes and severe instability.
Bringing private and public debt together gives the fullest picture. Ahead of the 1980s, for the world economy, rising private debt was perhaps sustainable because of falling public debt. Since the 1980s, rising private debt has been compounded by generally rising public debt. And then finally, since the global financial crisis private debts have effectively been socialised so that world total debt has proceeded to the unprecedented high that is the point of departure for the IMF commentary.
This continued and relentless leveraging across the great part of the world is an indictment of a catastrophic failure of policy both in the decades before and the decade after the global financial crisis. It seems unlikely that the end result will be benign: really, the global debt hyperinflation is in entirely unknown territory.
But we should remind ourselves that from the 1930s, Keynes and others found a different way forward. In reality ‘financial repression’ amounted to the repositioning of the financial system to serve the interests of industry and labour rather than the interests of the wealthy. The loaded language used by the IMF is a salutary reminder of the dominance of these interests today. But the fact is that when these interests were contained, the result was a vastly stronger and greatly more stable world economy. The solution to the likely future debt deflation is perfectly obvious.
Geoff Tily is Senior Economist at the TUC and author of ‘Keynes Betrayed’.
Keynes, J.M. ([1931] 1973), ‘An economic analysis of unemployment’, in The General Theory and After, Part I: Preparation, Collected Writings, vol. XIII, London: Macmillan/Cambridge: Cambridge University Press, pp. 343-67.
Reinhart, Carmen and Kenneth Rogoff (2009) This Time Is Different: Eight Centuries of Financial Folly, Princeton University Press.
Tily, Geoff (2015) ‘The long-term rate of interest as Keynes’s “villain of the piece”’, Review essay of ‘Long-term interest rates: a survey’, The Council of Economic Advisers (2015), Real World Economic Review, 73, Dec. http://www.paecon.net/PAEReview/issue73/Tily73.pdf
Tily, Geoff (2006) Keynes’s General Theory, the Rate of Interest and ‘Keynesian economics’, published in paperback (2017) as Keynes Betrayed, Palgrave Macmillan.