John Weeks is co-convenor of Economists for Rational Economic Policies, EREP
Who Rules Britain?
The allegation that finance capital (“the City”) rules Britain appears frequently in the media and serves as the central theme of many books (the sub-title above comes from the famous 1991 book by Scott). The assertion comes out of several inter-related arguments:
1) the large amount of revenue generated by the City makes the UK government beholden to finance capital; 2) finance funds the Conservative Party and strongly influenced Labour under Blair and Brown; and 3) the economic power of finance is so great that no government could take the political initiative to reform the City.
By the most liberal interpretation the first of these is an exaggeration. However, the second gained empirical support from a recent study estimating that half the contributions to the Conservative Party come from the City. The third allegation posits an all-pervasive power of the City working through MPs, the media and business economists to influence and constrain policy discussion such that debate rarely emerges.
There are obvious if politically difficult means to neutralise the political power arising from revenue generation and funding of political parties. Reform of the tax structure could replace much of the revenue generated by the City, for example through a more progressive personal income tax, whose revenue share has declined for thirty years.
Public sector funding of political parties combined with a prohibition on private contributions would end the ease by which special interests influence party policies. That private funding favours the interests of the wealth requires no deep investigation to verify. By no accident the pending Conservative “reform” of party financing would substantially reduce the public funds, especially to the Labour Party.
Finance Rules the Economy
Straightforward legislative changes would reduce power arising from public revenue generation and party funding. Much more difficult, to the point of intractable, is the power of finance arising from its role in the UK economy as a whole.
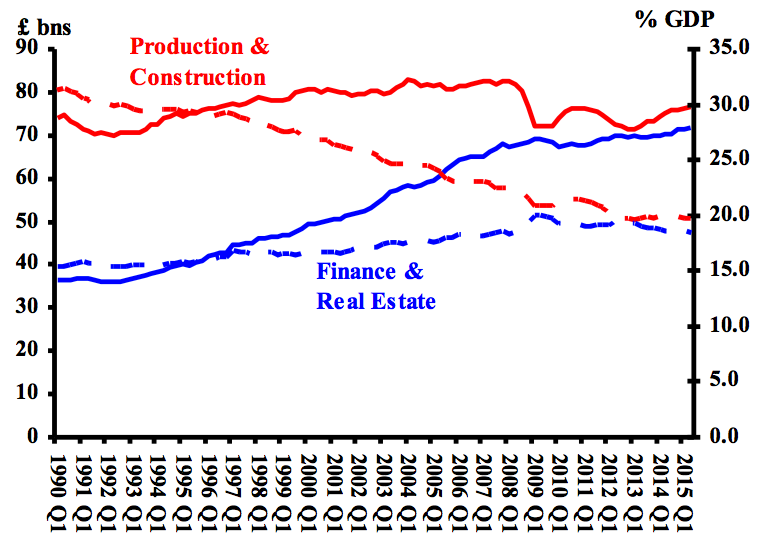
During the three decades following the Second World War finance played a subsidiary role in advanced countries. During these years in the economies of the United States and Western Europe people produced goods and services, transport moved them, wholesale and retail trade distributed them, and the financial sector provided the short and medium term funding when needed.
That type of an economy, produce then distribute with finance facilitating production, ended with the Reagan-Thatcher financial deregulation, deregulation extended under Clinton and Blair. Policy change, not “globalization”, liberated financial capital to break free of the production-distribution cycle which severely limited its potential for profit-taking. Suddenly, financial capital had a new and powerful mechanism to garner profit, speculation.
The transformation of Britain from a producing country to one ruled by financial speculation emerges from inspection of the FTSE 100 index over the last 30 years. The chart below shows quarter-on-quarter changes in the FTSE and growth of GDP during 1986-2015. Both variables are seasonally adjusted (especially important for the FTSE). A glance at the chart reveals what statistical tools verify – for the 18 years 1986-2004 the two lines show no systematic relationship, and during the next twelve years the two match each other’s movements (see notes to chart).
Quarter-on-quarter changes in GDP (blue) and the FTSE 100 stock index (red), 1986Q1-2015Q4 (seasonally adjusted)
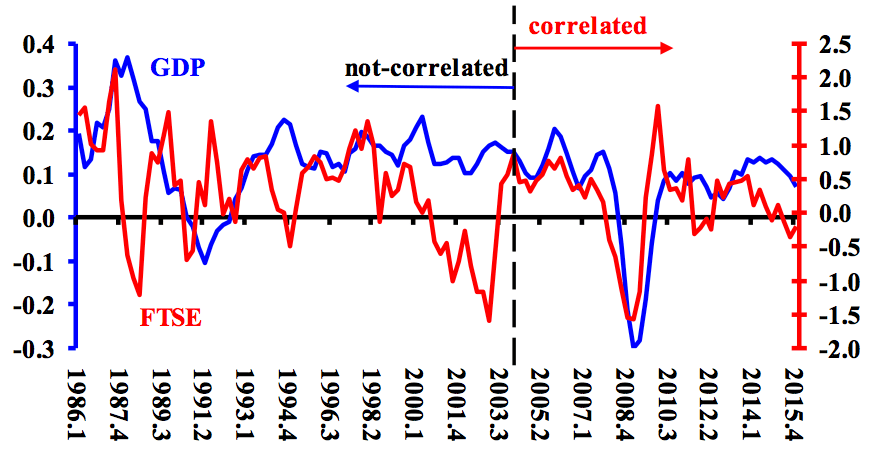
Sources: FTSE and GDP from ONS and OECD.
Notes: Both statistical series are seasonally adjusted. For GDP the adjustment is in the ONS source. For the FTSE adjustment is done by using a four quarter moving average. During the 1986 the relationship is non-correlated (non-significant t-statistic). For 2004-2015 the probability that the two are not correlated is less than one in 1000.
A second chart verifies the dramatic change in the link between the FTSE and GDP. The red line shows an index of statistical significance. Each point on the link refers to a calculation for the previous 12 quarters. Any value of the index below the horizontal axis is defined as non-significant, because the probability of no correlation is greater than 5% (a commonly used guideline).
The chart also shows the share of finance and real estate in GDP, with the average for the 25 years subtracted from the quarterly value (i.e., the horizontal axis equals the average for the 25 years). I include real estate value added because of how it facilitates the high speculative element in the sector (“housing bubbles”).
From 1990 through 2003, fourteen years or 56 quarters, the link between the FTSE and GDP growth was statistically significant for only fifteen times. During 2004-2015, the relationship was significant for 34 of 46 quarters (61%), and continuously so from mid-2008. Correlation does not imply causality. Suggestive of causality is that setting the FTSE value back one quarter yields greater significance that matching current quarters.
The chart tells us something that should cause worry – the link strengthened during the great financial collapse. It remains to be seen whether the decline in the index of simple correlation over the last four years implies a weakening of finance’s impact on the UK economy.
Statistical Significance of changes in GDP & FTSE (red) compared to share of finance & realestate in GDP (blue), 1990Q1-2015Q2
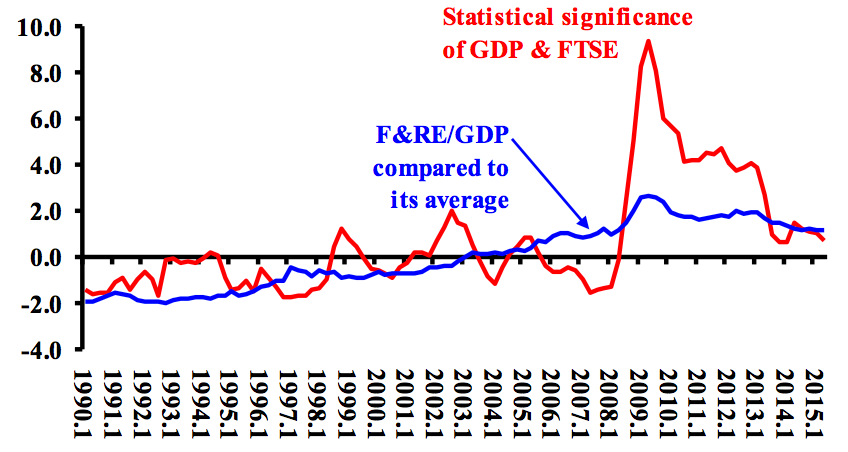
Notes: Statistical significance refers to simple correlation of seasonally adjusted changes, the t-statistic for the two variables, with the current rate of growth compared to the percentage change in the FTSE for the previous quarter. A value of zero (horizontal axis) indicates a 5% probability that the relationship is not significant. For the share of finance and real estate in GDP the horizontal axis is the average value for the 16 years (17.3%).