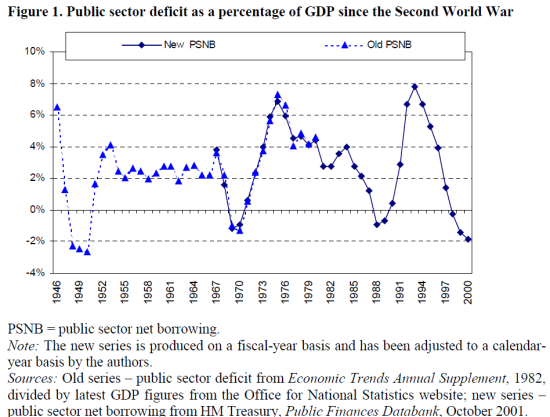
You will see that both of the great pre-2008 deficit peaks (at or near 8%) come during Conservative governments, and especially the boom-bust periods of Chancellors Anthony Barber (early 1970s) and Nigel Lawson (late 1980s). Each was responsible for unleashing a wave of financial and credit deregulation – Barber with the Competition and Credit Control (or rather, lack of credit control) policy in the 1970-74 Heath government, and Lawson with the “Big Bang” deregulation of the City of London in the late 1980s under the Thatcher government.
Since the third great crash, of 2008/9, was also caused by the actions of a deregulated finance and banking sector, we may surely conclude that there is a direct causal relationship, as well as correlation, between financial deregulation and high peak deficits.
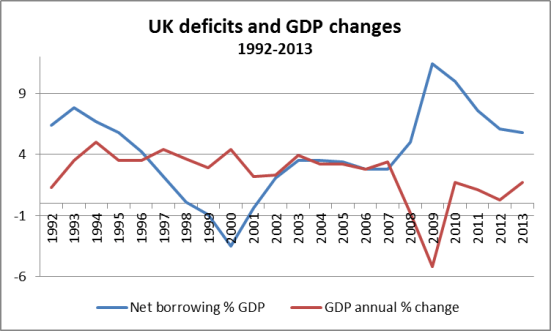
The second chart covers a shorter period, from 1992 to 2012, and here we have also shown the real GDP annual % growth alongside the annual deficit as % of GDP.
In the case of deficits, please note, the figures are for nominal borrowing and GDP. However, the relationship is an interesting one. In 1992, government borrowing grew (as a % of GDP) and so did real GDP, as the country clawed its way out of the deep recession. Then, as the economy recovered, net borrowing fell each year until, under the Labour government, there was a surplus for 3 years. When net borrowing started again in 2002, it reached 3.5% in 2003 and 2004, but then fell again until the crisis. That is, the average deficit figure for the pre-2008 period of the Labour government was about the same as under the Conservative governments of the 1950s.
Note too that the annual increase in GDP up to 2008 remained relatively constant, and ran in tandem with the deficit. Then came the financial crisis which – as in each major crisis, of which this was the worst since the 1930s – caused borrowing to leap upwards as receipts fell and unemployment-related benefits grew rapidly.
At the same time, a fiscal stimulus was attempted by the Labour government, which increased short-term borrowing while also helping to kick-start the economy again. This had a positive effect, as can be seen by the fact that GDP grew by 1.7% in 2010, the same as in 2013. In between, the government’s and Chancellor’s austerity policies started to bite and while the deficit was forced down somewhat – so was economic activity.
GDP in 2011 was just 1.1% higher than 2010, and this fell back to the vanishingly small 0.3% in 2012. Over the period 2010 to 2013, the increase in GDP was lower than the increase in population.
Finally, we see that in 2013 several things happen – GDP increases by 1.7% while the rate of reduction in the “deficit” slows as a % of GDP. For as we know, for all the pain imposed, the rate of reduction of the deficit year by year is far slower than had been planned by the government in 2010, and in fact slower than the Labour Party had proposed!
The failure of government to invest
PRIME’s view is different still. The biggest failing of this government – and of the Labour proposal for dealing with the deficit – was to cut back on government investment in good long-term projects. Of course an investment-led strategy would have increased borrowing in the short term, but the pay-back would have been far quicker in terms of growing economic activity and tax receipts, as well as providing long-term benefits to the country. It would have greatly increased private sector activity, through government contracts, at a time when the private sector was unable or refusing to invest.
On a slightly different point, Chart 3 shows the (non-causal) relationship between changes in UK gross public debt and changes in public spending as a percentage of GDP.
Note that public debt as a % of GDP grew in the mid-1990s under the last Conservative government to over 50%, at the same time as public spending was falling as a percentage of GDP! Even in 2007/8, both public spending as a percentage of GDP, and debt as a percentage of GDP, were lower than in the last years of the last Conservative government.
Un(der)regulated finance sector causes deficits
In conclusion, the real issue is not deficits, nor (within reason) the size of the public sector. The real issue is that an un(der)regulated financial sector is potentially and actually disastrous for our economies.
In a moment of clarity, Messrs Reinhart and Rogoff point out that in the post 2nd World War period until the 1970s, there were no major banking crises. In “This Time It’s Different”, they include a chart (13.1) at p.205 which plots the proportion of countries with banking crises, from 1900 to 2008, weighted by their share of world income. It shows several peaks from 1900 to 1928, then the giant peak of the Great Depression, falling back to almost zero in 1940. Barring a small hill in the 1947-50 period, the chart is completely flat at zero until 1972, since when it rises and falls dramatically, most recently in 2008-9. They comment:
“Figure 13.1 also reminds us of the relative calm from the late 1940s to the early 1970s. This calm may be partly explained by booming world growth but perhaps more so by the repression of the domestic financial markets (in varying degrees) and the heavy-handed use of capital controls that followed for many years after World War II…
Since the early 1970s, financial and international capital account liberalization – reduction and removal of barriers to investment inside and outside a country – have taken root worldwide. So, too, have banking crises…”
And it is financial and banking crises that, above all, cause high deficits and high levels of public debt.
So for the future, the question is – are we once more heading for a boom-bust and financial crisis? We are certainly not there yet, but in our view, the overall policy is a sadly familiar one, based on soaring but ultimately unsustainable asset prices. Will George Osborne’s name forever be linked with Messrs Barber and Lawson? We think, on balance, yes.


