

In a recent article, we examined data on UK deficits and debt over the last 25 years, which covers 13 years of Labour governments and 12 years of Conservative(-led) ones. We showed that overall, Labour governments have been more fiscally conservative than Conservative ones.
We have now translated this into average annual deficits – both on current budget (i.e. excluding capital investment) and on the overall budget (including investment borrowing) – and turned it into charts. The picture is stark, and should surely cause even Mr Osborne to blush.
As appears from Chart 1, in terms of the overall annual deficit, the average as a percentage of GDP was 5.7% under Conservative governments for the period, and 2.4% for Labour governments – this includes the 2009/10 peak deficit of 10.2%.
Chart 1
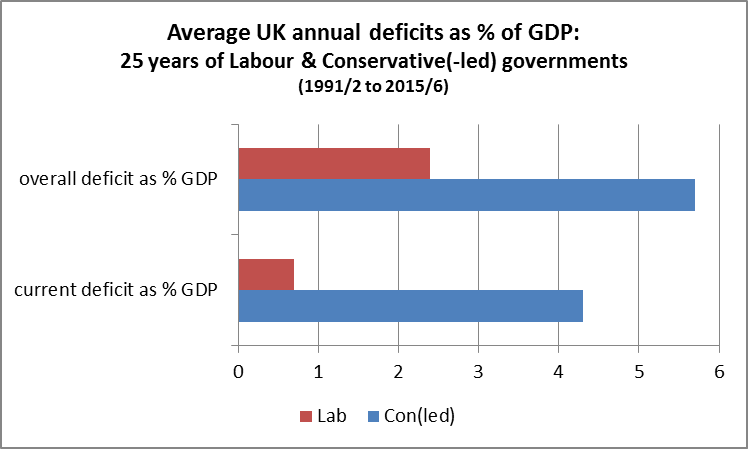
When it comes to current budget spending (i.e. excluding capital investment spending) the Conservative government average is a stunning 4.3%, whilst the Labour government average is just 0.7%. That is, over the whole 13 years of government, including the financial crash, current spending was on average close to balance. This average covers the early post 1997 period when a current surplus was posted in 3 years, but prior to the financial crisis, 2004/05 was the only year in which the current deficit exceeded 1.1% of GDP, at 1.6%. The lowest current deficit under a Conservative government was 1.7% in 1991/2, and since then, never a year under 2%.
In case it is thought that we are being over-hard on the Coalition government that took office in May 2010 and certainly inherited a high deficit, we have also looked at the averages for the same period but excluding the first two years of the Conservative-led Coalition (with overall deficits of 8.6% and 7%). Even taking these years out, the picture hardly changes. This shown here in Chart 2:


One Response
Does any of this take into account the loss of our triple-A credit rating in 2011? Surely that would affect the cost of repayment and increase the deficit for Oddballs?