In 2014, the UK’s private non-financial corporations (PNFCs) as a totality had their best year on record for profitability since 1998/99 (the ONS series began in 1997), and quarterly figures for 2015 to Q3 indicate that last year will at least match 2014. Indeed, all the signs are that the service sector will achieve percentage rates of return that have no equal in the records.
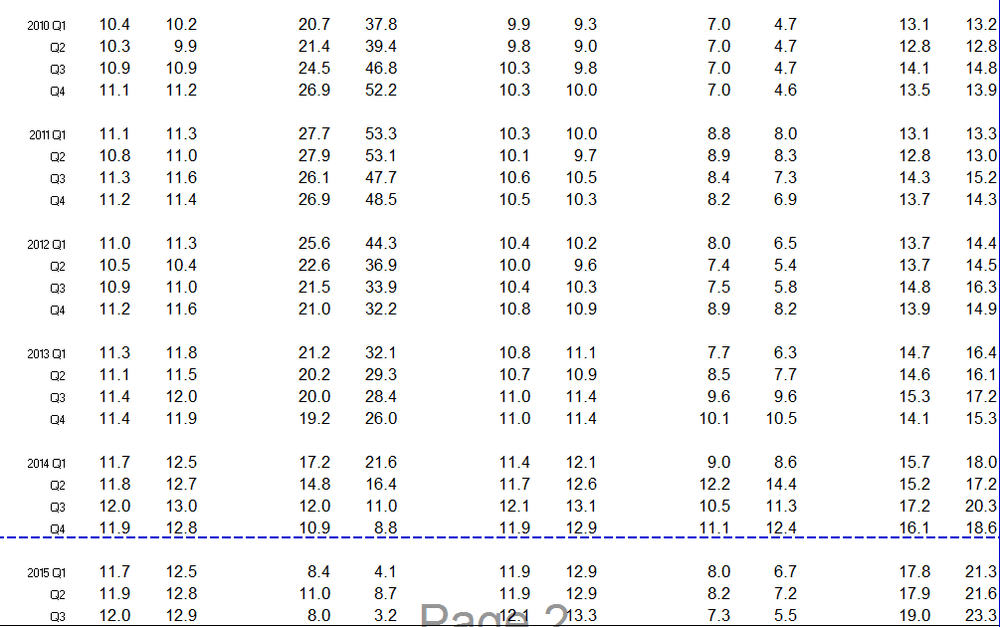
In figures released by ONS today, we note from Table 1 that the gross rate of return for all PNFCs in 2014 was 11.9%, and the net [1] rate of return 12.8%. The overall total was dragged down a little by the lower than usual rate of return of the North Sea oil and gas sector (UKCS, or Continental Shelf), but even manufacturing companies had an excellent year in 2014.
Turning to the quarterly figures for 2015, set out in Table 2, the first three Qs seem to be almost identical to 2014 up to Q3 for PNFCs, but the North Sea Oil and Gas sector was having a particularly bad year, as bad as or worse than 1998 for profitability. Manufacturing was also achieving a rate of return at a lower level, last seen in 2012.
But the most stunning figures for 2015 come from the service sector. Service PNFCs have been achieving rates of return unseen previously – in Q3 the gross RoR was 19%, and the net return a stunning 23.3%. The previous highest quarter for gross profitability was Q3 1997, and for net profitability… well, till now the service sector has never had it so good! (The previous pre-2014 high net RoR was also Q3 1997, at a mere 19.8%).
So however tough the economic times are for the rest of us, these are halcyon days for Britain’s PNFCs in terms of the rates of return their businesses are generating. Unless, that is, you happen to be in the North Sea oil and gas business.
(Both Tables below are snapshots from the relevant ONS excel file available from here)
Table 1. Annual Rates of Return of Private Non-Financial Corporations – Summary
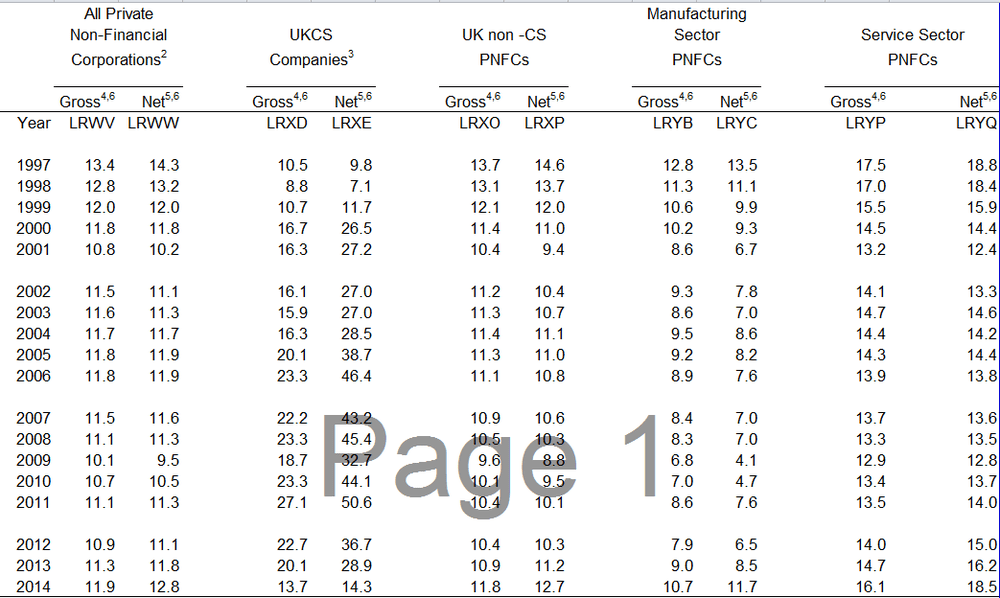
Table 2. Quarterly Rates of Return of Private Non-Financial Corporations – Summary