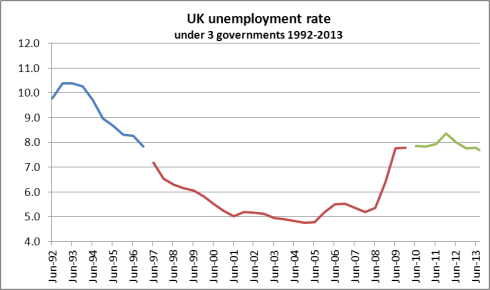
It was a busy week, statistically speaking, with the UK Office for National Statistics (ONS) issuing their latest raft of data on the labour market and unemployment, as well as the latest inflation statistics. It got us tweeting quite a lot, so much in fact that we did not get round to posting it all on our PRIME site. To make up for this, we have decided to post (see below) many of our tweets which (as befits autumn) are full of the succulent fruits of fact and argumentation!
The headline news is that employment is indeed rising, broadly in line with the growth in population and workforce – but unemployment remains stuck at or about the 2.5 million mark where it has been (apart from an upward push in 2011) since the Coalition government came into office in May 2010. The percentage has come down a fraction, but in reality, the last 2 single months’ seasonally adjusted figures – ONS averages the latest 3 months to get its headline figure – have been higher again than in June and are back at 8%. The August figure is 2.56 million unemployed, while the 3 month rolling average shows 2.487 million.
The other headline fact is that CPI annual inflation is stuck at 2.7%, whilst the latest total weekly earnings annual increase is down to 0.7%, leaving a large gap opening up again between wages and inflation. So once again, the argument that wages are the (or even a) main cause of inflation has been shown to be untrue.
In fact, as we tweeted, (see below), there has been no period under the present government when total earnings rose faster than CPI inflation. That is, real wages have been falling throughout the life of the government.
And another interesting point – of the 740,000 additional jobs since June-August 2010, for every 2 employees, there is 1 new self-employed person. And more than half of the new self-employed is part-time. This is evidence of a major change in the structure of the UK workforce, and is related to the issue of the declihne in real earnings, due o the extreme “flexibility” (lack of protection) provided by UK employment legislation.
So now on to our Tweetweek.
We have put some abbreviated words in full, since we are here free of the 140 character constraint. Otherwise, they stand as delivered.
Social justice? UK September CPI inflation = 2.7%. Minimum wage up 1st October by 1.94% (1% for 18-20 yrs). CEOs 2013 total pay rise = 15.8%
CPI inflation 0.7% in September. Average total annual pay increase over 3 mths to Aug = 0.7%. Real pay average = -2%!
Under Cameron government, there is no period when pay has NOT fallen in real terms. Last time it beat CPI: Jan-April 2010
To note. From @statisticsONS we find that number of UK unemployed is higher now than when Coalition government took office in 2010
unemployment under 3 govts
UK unemployment (16+): when government took office: May-July 2010 2.475 million. Latest: June-Aug 2013 2.487 million. Up by 12,000. For 16-64 year olds, up by 6,000
August single month (not a national statistic) unemployment back to 8%, 180,000 up on June. Wild gyrations in recent months. Trend or outlier?
UK unemployment June-Aug 2010 = 2.455 million. Unemployment June-Aug 2013 = 2.487 million. That’s an increase of 32,000
Looking at “not seasonally adjusted” unemployment, it’s 2.554 million, 67,000 more than seasonally adjusted figure. 20,000 more than same 3 months 2010
5 year picture. June/Aug 2008: 29.49 million in employment, 1.87 million unemployed. Jun-Aug 2013 29.98 million in employment, 2.55 million unemployed. Employed +487,000, unemployed +687,000
You asked @Alanrew, so here goes! From June/Aug 2008-2013 Full-time employees -1.54%, part-time employees +3.91%. Full-time self-employed +5.25%, part-time self-employed +27.83%
@Alanrew. Same, but compare June/Aug 2010-13. F/t employees +2.87%, p/t employees -0.95%, F/T self-employed +3.75%, p/t self-employed +13.26. But part-time self-employed only = 1.162 million
How @statisticsONS gets unemployment of 2.487m: Add up last 3 single months: Jun 2.386 million, July 2.510 million, August 2.566m. Divide by 3. Note + trend
@D_Blanchflower Comparing those in work June-Aug 2010-13: Overall increase +741,000 Full-time +662k. But F/T employees +521,000, part-time employees -64,000. Full-time self-employed +110,000, part-time self-employed +136,000.
@D_Blanchflower So from June/Aug 2010-2013: employees +457,000, & self-employed +246,000, of which over half are part-time self-employed. Unemployed +32,000
@D_Blanchflower Agreed, no truthful way you can get to a million [new jobs under current government, as it has claimed]! & with rising work age population it’d be terrible if not some + in work. [inserted in this post as explanation]


